
When disaster strikes, it’s important to know what locations and infrastructure may be at risk and what resources are available. For times such as this, OR&R’s mapping tool, MARPLOT®, can help mitigate disaster.
With the ability to customize maps and their features, MARPLOT appeals to users like Greg Moser, emergency management coordinator for Westminster, Colorado, who use mapping tools to do all-hazards community risk assessment.
Developed jointly by NOAA and the Environmental Protection Agency (EPA) as part of the CAMEO software suite, this mapping program allows users to select a variety of basemaps as the background image, add their own objects to maps, and customize their map further with annotations and online Web Mapping Service (WMS) layers.
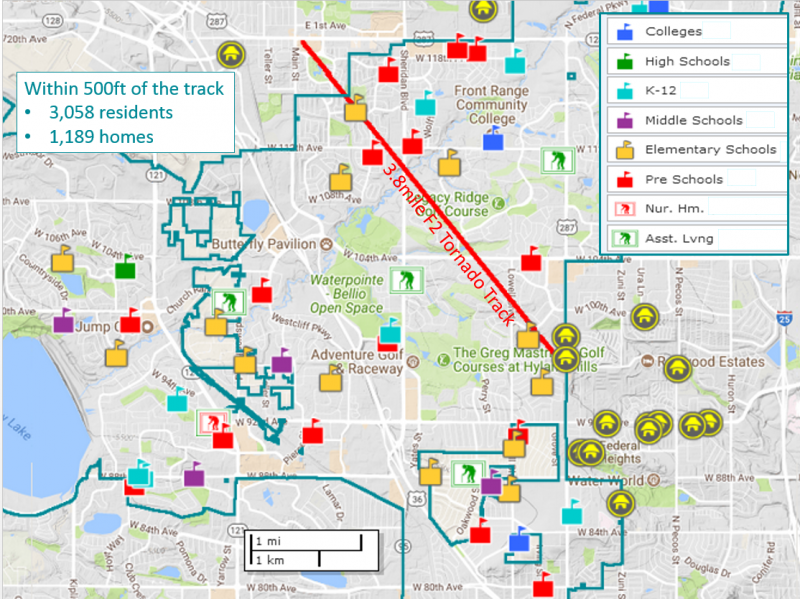
Using this program, Moser can map all his city’s key infrastructure — such as water treatment facilities, power and natural gas lines, radio towers, and major roads — and compare these sites against the locations of previous hazards faced by his community, such as extreme flooding, hail, tornadoes, fires, earthquakes, and extreme temperatures. Seeing these resources and hazards mapped together, Moser and his team can then determine if some of their community’s most important (or sensitive) resources may be at risk from a natural disaster in the future.
For example, Moser has mapped flooding and dam failure inundation areas from all of the major dams in his area. Viewing these areas allows him and his team to assess what resources and sensitive populations might be at risk in the case of extreme rainfall.
Moser first used MARPLOT to assess community hazmat risk, which analyzes the risks posed by hazardous materials in the community.
“That sparked me to think, ‘If I can plot hazmat, what else can I do?’,” he said. “This has been driven by my need for a community risk assessment, which is pretty fundamental to emergency management. We all do risk assessments, but I can’t say I am impressed with the common practice. Being able to create maps adds enormous value to the ability to manage and assess data, and do evidence-based analysis.”
Before discovering the CAMEO software suite at a training session two years ago, Moser had to rely on GIS staff or expensive contractors to run his assessments.
“I have a great GIS department, but being able to build basic GIS myself is hugely empowering,” Moser said. “ArcGIS and Esri [a GIS software company] are just a little beyond where I felt I could go. Also, my GIS department is focused on info about the city. As an emergency manager, I have to look regionally.”
The process of learning to use a mapping program not only gave Moser new insights into GIS, but also into his community.
“I learned a lot more about my community by building my own maps,” he said. “I now have a canned database of over 100 layers that let me look at my community and its relationship to all hazards through various filters.”
Moser’s risk assessment will become part of his Hazard Mitigation Plan, which is required under the Hazard Mitigation Act of 2000 for cities to be eligible for FEMA mitigation grant funds.
He has found MARPLOT to be an indispensable tool in his office. Although he is fortunate enough to have strong GIS support, he still uses MARPLOT because it allows him to routinely create and tailor GIS products. He also imports publically available federal and state information directly into the program, where he can further modify and customize the map layers. Because this software is free, using MARPLOT to build maps for his community and its hazards is much more cost effective than paying a consultant or even the city’s own GIS staff.
“I am pretty proud of what we have been able to build using this tool,” Moser said.
Greg Moser isn’t the only one who uses MARPLOT for emergency planning. Users have found dozens of ways to use MARPLOT to keep their communities safe, such as providing aerial ambulances with the direction and distance to local hospitals; mapping evacuation routes and collection sites for hazmat containers displaced by the hurricanes and tornadoes; using custom-generated grids for search and rescue operations; and even mapping areas of brush removal in preparation for harsh wildfire seasons.
Download MARPLOT for PC or Mac and see what you can build!
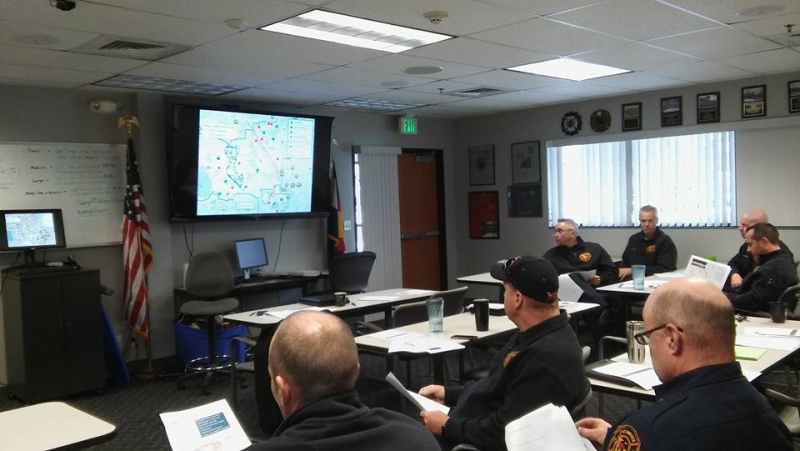
For more information on how the City of Westminster, Colorado uses MARPLOT for emergency management, watch this video from a Community Risk Scoring Workshop.