
Originally published on March 30, 2015.
The Deepwater Horizon Oil Spill
Oil spills raise all sorts of scientific questions, and NOAA's job is to help answer them. We have a saying that each oil spill is unique, but there is one question we get after almost every spill: Where will the oil go? One of our primary scientific products during a spill is a trajectory forecast, which often takes the form of a map showing where the oil is likely to travel and which shorelines and other environmentally or culturally sensitive areas might be at risk.
Oil spill responders need to know this information to know which shorelines to protect with containment boom, or where to stage cleanup equipment, or which areas should be closed to fishing or boating during a spill.
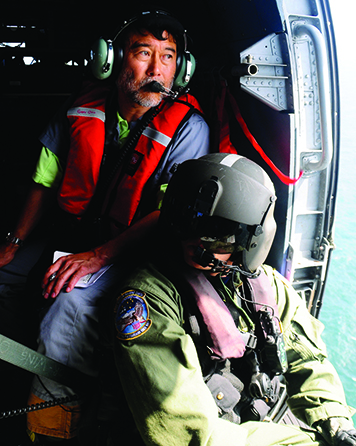
To help predict the movement of oil, we developed the computer model GNOME to forecast the complex interactions among currents, winds, and other physical processes affecting oil's movement in the ocean. We update this model daily with information gathered from field observations, such as those from trained observers tasked with flying over a spill to verify its often-changing location, and new forecasts for ocean currents and winds.
Modeling a Moving Target
One of the biggest challenges we've faced in trying to answer this question was, not surprisingly, the 2010 Deepwater Horizon oil spill. Because of the continual release of oil—tens of thousands of barrels of oil each day—over nearly three months, we had to prepare hundreds of forecasts as more oil entered the Gulf of Mexico each day, was moved by ocean currents and winds, and was weathered, or physically, biologically, or chemically changed, by the environment and response efforts.
A typical forecast includes modeling the outlook of the oil’s spread over the next 24, 48, and 72 hours. This task began with the first trajectory our oceanographers issued early in the morning April 21, 2010 after being notified of the accident, and continued for the next 107 days in a row. (You can access all of the forecasts from this spill online.)
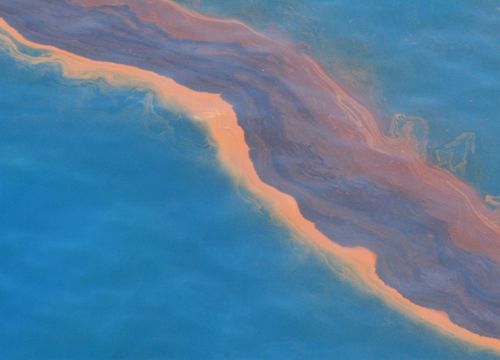
Once spilled into the marine environment, oil begins to move and spread surprisingly quickly but not necessarily in a straight line. In the open ocean, winds and currents can easily move oil 20 miles or more per day, and in the presence of strong ocean currents such as the Gulf Stream, oil and other drifting materials can travel more than 100 miles per day. Closer to the coast, tidal currents also can move and spread oil across coastal waters.
While the Deepwater Horizon drilling rig and wellhead were located only 50 miles offshore of Louisiana, it took several weeks for the slick to reach shore as shifting winds and meandering currents slowly moved the oil.
A Spill Playing on Loop
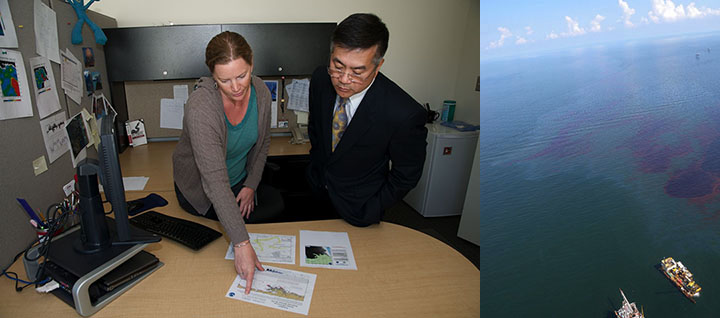
Over the duration of a typical spill, we’ll revise and reissue our forecast maps on a daily basis. These maps include our best prediction of where the oil might go and the regions of highest oil coverage, as well as what is known as a "confidence boundary." This is a line encircling not just our best predictions for oil coverage but also a broader area on the map reflecting the full possible range in our forecasts [PDF].
Our oceanographers include this confidence boundary on the forecast maps to indicate that there is a chance that oil could be located anywhere inside its borders, depending on actual conditions for wind, weather, and currents.
Why is there a range of possible locations in the oil forecasts? Well, the movement of oil is very sensitive to ocean currents and wind, and predictions of oil movement rely on accurate predictions of the currents and wind at the spill site. In addition, sometimes the information we put into the model is based on an incomplete picture of a spill. Much of the time, the immense size of the Deepwater Horizon spill on the ocean surface meant that observations from specialists flying over the spill and even satellites couldn't capture the full picture of where all the oil was each day.
Our inevitably inexact knowledge of the many factors informing the trajectory model introduces a certain level of expected variation in its predictions, which is the situation with many models. Forecasters attempt to assess all the possible outcomes for a given scenario, estimate the likelihood of the different possibilities, and ultimately communicate risks to the decision makers.
In the case of the Deepwater Horizon oil spill, we had the added complexity of a spill that spanned many different regions—from the deep Gulf of Mexico, where ocean circulation is dominated by the swift Loop Current, to the continental shelf and nearshore area where ocean circulation is influenced by freshwater flowing from the Mississippi River. And let's not forget that several tropical storms and hurricanes crossed the Gulf that summer.
A big concern was that if oil got into the main loop current, it could be transported to the Florida Keys, Cuba, the Bahamas, or up the eastern coast of the United States. Fortunately (for the Florida Keys) a giant eddy formed in the Gulf of Mexico in June 2010 (nicknamed Eddy Franklin after Benjamin Franklin, who did some of the early research on the Gulf Stream). This "Eddy Franklin" created a giant circular water current that kept the oil largely contained in the Gulf of Mexico.
Some of the NOAA forecast team likened our efforts that spring and summer to the movie Groundhog Day, in which the main character is forced to relive the same day over and over again. For our team, every day involved modeling the same oil spill again and again, but with constantly changing results.
Thinking back on that intense forecasting effort brings back memories packed with emotion—and exhaustion. But mostly, we recall with pride the important role our forecast team in Seattle played in answering the question "where will the oil go?