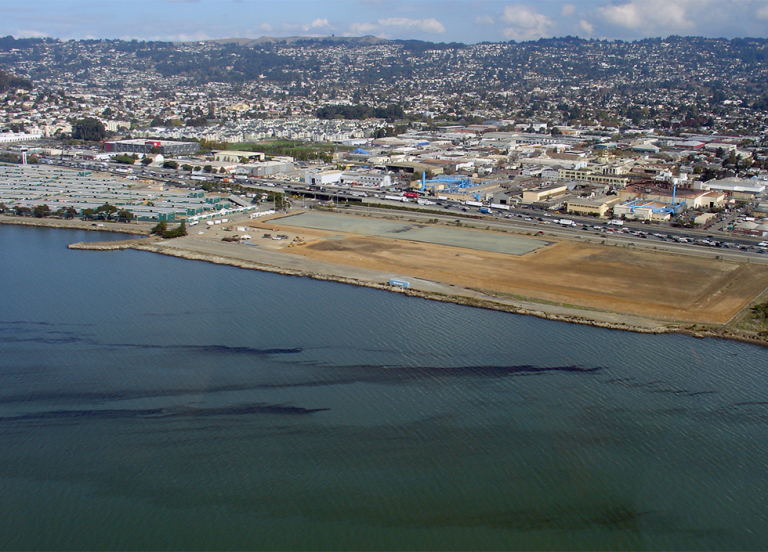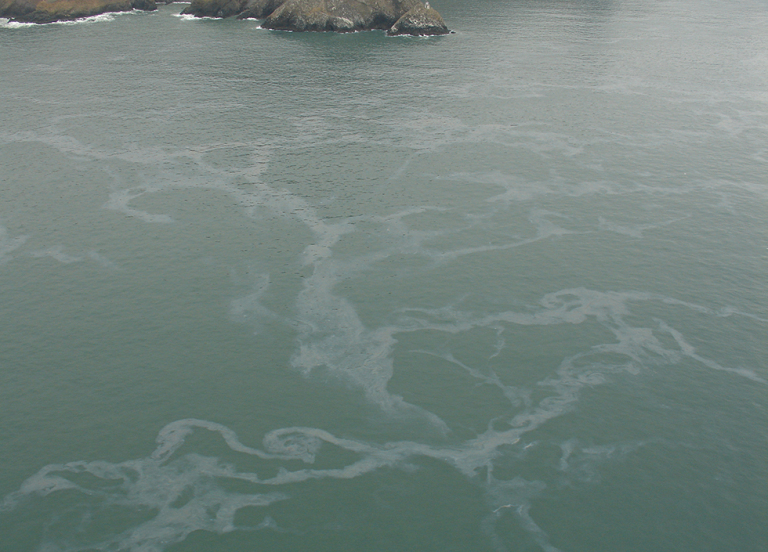
One foggy morning in 2007, a cargo ship was gliding across the gray waters of San Francisco Bay when it ran into trouble, quite literally. This ship, the M/V Cosco Busan, struck the Bay Bridge, tearing a hundred-foot-long gash in its hull and releasing 53,000 gallons of thick, sticky fuel oil into the bay.
When such an oil spill, or even the threat of a spill, happens in coastal waters, the U.S. Coast Guard asks the oceanographers at NOAA’s Office of Response and Restoration for an oil spill trajectory.
Watch as NOAA’s Ocean Service breaks down what an oil spill trajectory is in a one-minute video, giving a peek at how we model the oil’s path during a spill.
Using a specialized NOAA computer model, called GNOME, our oceanographers forecast the movement of spilled oil on the water surface. With the help of data for winds, tides, weather, and ocean currents, they model where the oil is most likely to travel and how quickly it may come ashore or threaten vulnerable coastal resources, such as endangered seabirds or a busy shipping lane.
During the Deepwater Horizon oil spill, we produced dozens of oil spill trajectory maps, starting on April 21 and ending August 23, 2010, when aerial surveys and satellite analyses eventually showed no recoverable oil in the spill area. You can download the trajectory maps from that spill.

Learn more about how we model and respond to oil spills:
Attempting to Answer One Question Over and Over Again: Where Will the Oil Go?
“Over the duration of a typical spill, we’ll revise and reissue our forecast maps on a daily basis. These maps include our best prediction of where the oil might go and the regions of highest oil coverage, as well as what is known as a “confidence boundary.” This is a line encircling not just our best predictions for oil coverage but also a broader area on the map reflecting the full possible range in our forecasts [PDF].
Our oceanographers include this confidence boundary on the forecast maps to indicate that there is a chance that oil could be located anywhere inside its borders, depending on actual conditions for wind, weather, and currents.”
A Bird’s Eye View: Looking for Oil Spills from the Sky
“Aerial overflights are surveys from airplanes or helicopters which help responders find oil slicks as they move and break up across a potentially wide expanse of water … Overflights give snapshots of where the oil is located and how it is behaving at a specific date and time, which we use to compare to our oceanographic models. By visually confirming an oil slick’s location, we can provide even more accurate forecasts of where the oil is expected to go, which is a key component of response operations.”
Five Key Questions NOAA Scientists Ask During Oil Spills
“Responders can potentially clean up what is on top of the water but recovering oil droplets from the water column is practically impossible. This is why it is so important to spill responders to receive accurate predictions of the movement of the surface slicks so they can quickly implement cleanup or prevention strategies.”
