
On April 20, 2020, NOAA will join our state and federal partners in observing 10 years after the Deepwater Horizon oil spill — an incident that resulted in the tragic loss of human life and an unprecedented impact to the Gulf’s coastal resources and the people who depend on them. From March 30 to April 20, tune in as we go back in time to the day of our country’s largest marine oil spill, what’s happened since then, and how we’re better prepared for future spills. In our latest blog, learn more about how data tools used and developed during Deepwater Horizon help to protect coastal resources.
The 2010 Deepwater Horizon spill was the largest marine oil spill in American history. The response and assessment involved thousands of people from universities, state, and federal agencies for years after. Scientists assessed injuries to natural resources by collecting data from a wide variety of species and habitats across over 43,000 square miles up to 5,000 feet deep from boats, beaches, satellites, airplanes, submersibles, communities, and laboratories.
The volume of scientific data collected in the wake of Deepwater Horizon was unprecedented, requiring new and improved tools to house and display this information for responders, researchers, and the public. These tools include:
ERMA (Environmental Response Mapping Application): ERMA is an online mapping tool that combines both static and near real-time data in a centralized, easy-to-use tool for environmental responders and decision makers. ERMA was being developed just before Deepwater Horizon in March 2010, and was fully put into action for the response. ERMA was significantly updated to meet the needs of the immense spill and is now a standard tool for oil spills and other disasters. For example, during a hurricane, ERMA displays both the storm’s progress and information like wave heights, wind speeds, flood zones, and shoreline types, helping responders make sound and timely decisions to help save lives and property.
NOAA’s DIVER (Data Integration, Visualization, Exploration, and Reporting): DIVER is a massive warehouse that allows users to search through, visualize, and download huge amounts of data on environmental pollution. Agencies can upload information collected during pollution response, assessment, and restoration efforts, and then share it easily. The DIVER platform was initially developed to manage, standardize, and share the unprecedented scale and volume of environmental data created during the response and assessment to the Deepwater Horizon oil spill. This innovative approach to centralizing and sharing environmental data and related information has been expanded to include the legacy of contaminant chemistry and bioassay data from over 20 years of NOAA assessment and restoration work.Here Are 7 Ways NOAA Data Tools Protect and Restore Coastal Resources and Keep the Public Informed
Improving Oil Spill Coordination Between NOAA and the U.S. Coast Guard
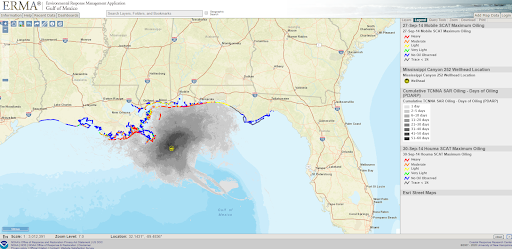
The U.S. Coast Guard has the primary responsibility for managing oil and chemical spill clean-up activities, while NOAA provides the scientific support critical to making decisions during emergency responses. ERMA is an important tool that NOAA and the Coast Guard use to share and visualize information during oil spill drills and responses, providing a common operating picture of the spill as it evolves.
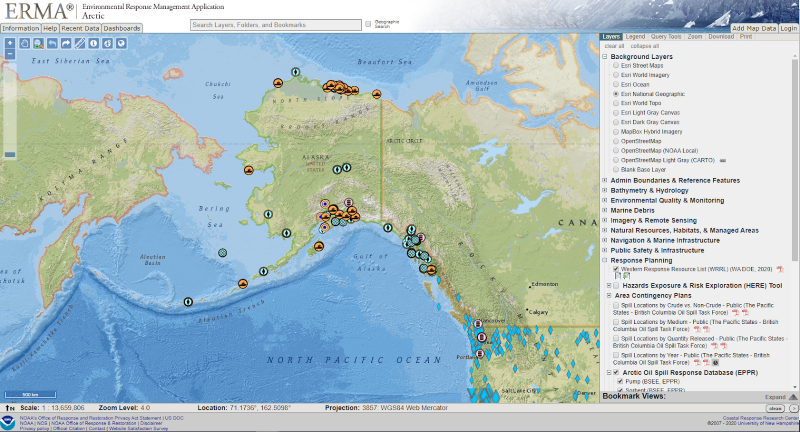
This ERMA map shows the location of resources that may be needed in the case of an Arctic oil spill. Knowing where response equipment like pumps, booms, skimmers, airplanes, trained personnel, and specialised vessels are located and who owns them is information that needs to be accessed quickly. By displaying this information in one location, ERMA helps coordinate NOAA and Coast Guard efforts for the most efficient response possible. This helps to minimize impacts from the spill and maximize recovery of affected resources and communities.
Displaying Marine Pollution Surveillance Reports for the Public
ERMA allows oil spill authorities from federal, state, and local levels to visualize the oil spill in one place, and to access other public data to help make informed decisions.


Putting Geographic Response Plans in Place to Protect Important Areas
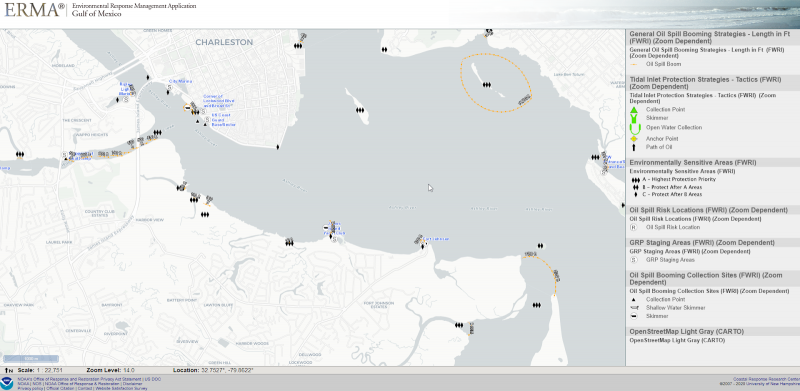
Geographic Response Plans are guides for actions during an oil spill response. These plans help responders to deploy predefined strategies at previously identified areas of significant economic, cultural, and ecological value.
ERMA keeps these plans in one place so they’re easily accessed by oil spill responders at the state level. The map below shows Geographic Response Plans for Oregon and Washington, where NOAA integrates data from partners in both states for use by oil spill responders. The data are regularly updated in ERMA, ensuring that up-to-date data is always available.
Making Environmental Sensitivity Maps (ESI) Accessible Quickly
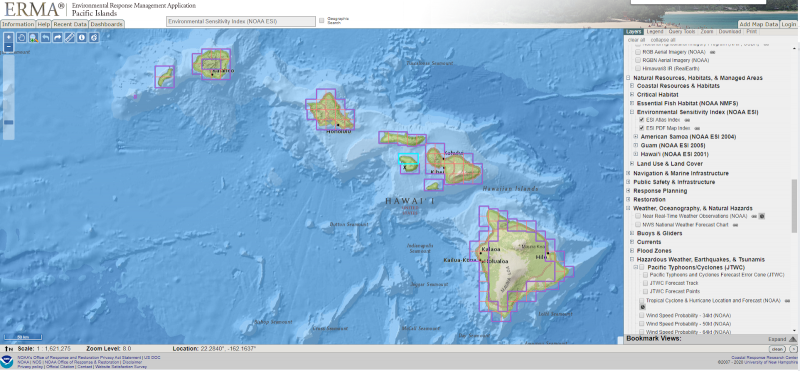
Environmental Sensitivity Index (ESI) maps provide concise summaries of coastal resources, like the locations of different natural and man-made types of coastline, sensitive habitats, and the locations and times important species are found in the area. When a spill occurs, ESI maps can help responders protect sensitive species from the spill and cleanup actions. ERMA stores and displays thousands of ESI maps across the United States and outlying territories.
For example, if you want to prepare for an oil spill on Lanai, an island in Hawaii, you can go to ERMA Pacific Islands, zoom in on Lanai, and open the ESI map as a PDF which also shows lists of resources and local points of contact. One of the things you’d learn is that Humpback whales are found in the area, and their calving season is from January to April. ERMA allows this critical information to be accessible quickly and clearly.
Sharing Restoration Projects in the Gulf of Mexico With the Public
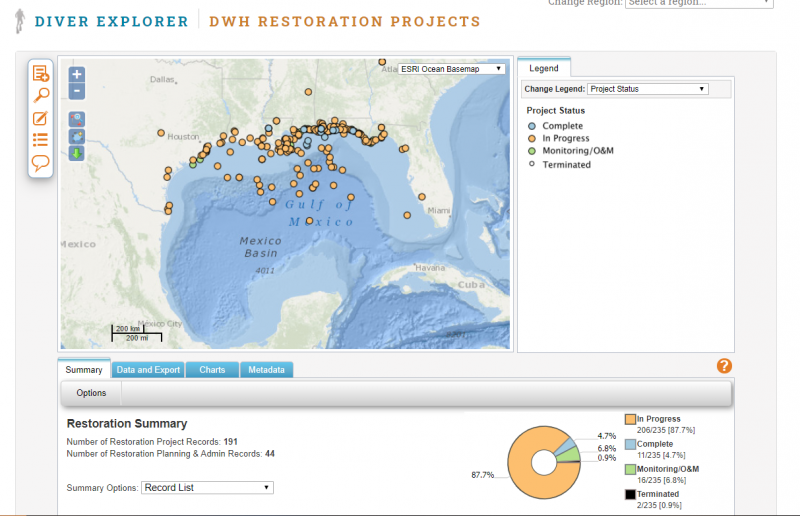
NOAA’s DIVER application was originally created to integrate and organize millions of records of environmental assessment data and help reach the historic $8.8 billion Natural Resource Damage Assessment (NRDA) settlement in 2016. The DIVER platform is now used by the federal and state NRDA trustees to manage restoration project information and to provide the public with up-to-date reporting on the progress of restoration projects funded by this settlement.
There are currently more than 175 restoration projects ongoing across the Gulf of Mexico, with many more to come. By using DIVER Explorer, people can filter for resources they care about, including projects benefiting sea turtles or oysters, or filter by state to see what’s happening close to home. Information on restoration projects that are managed in DIVER is also available for visualization in Gulf of Mexico ERMA, and in mapping applications such as the Gulf Spill Restoration Projects interactive map.
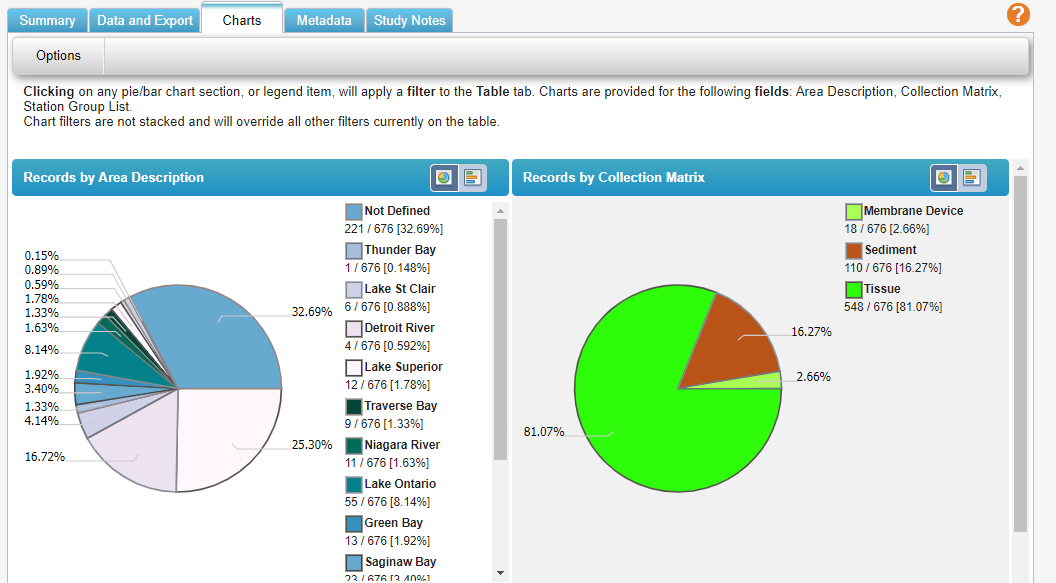
Making Great Lakes Mussel Watch Data Visible and Searchable
Freshwater mussels are widely used as sentinels to help scientists monitor and understand pollution because they are filter-feeding, stationary bottom-dwellers that accumulate chemicals in their bodies. Tissue concentrations coupled with levels of contaminants in sediments help provide insight into the health of the Great Lakes and the trends in pollution levels.
NOAA’s Mussel Watch program, part of NOAA’s National Status and Trends, started monitoring in the Great Lakes in 1992 and has helped track pollution levels and cleanup effectiveness across all 5 of the Great Lakes. DIVER houses all of these data collected from 1992-2017, making monitoring results from nearly 700 stations accessible to the public for review, filtering and downloading through the Explorer query tool. DIVER additionally has NOAA’s Mussel Watch data from across the country from 1986 until the most recent sampling in 2017 available for query, download and further analysis.This encompasses approximately 4800 stations with sediment and tissue analytical chemistry results that are standardized and downloadable.

Sharing the Millions of Environmental Data Records and Thousands of Map Layers from the Deepwater Horizon Oil Spill with Scientists and the Public
Ten years after Deepwater Horizon oil spill, and four years since the historic $8.8 billion settlement with BP to fund restoration, DIVER is still used to provide the public access to millions of environmental data records and thousands of ERMA’s spatial data layers from the response and natural resource damage assessment. This provides both big picture visuals and detailed datasets to understand the impact of Deepwater Horizon on the Gulf of Mexico.
Data sharing is the crux of data tools like ERMA and DIVER. Not only do these tools allow NOAA to share data with our partners to maximize efficiency and facilitate collaboration, but we also share huge amounts of NOAA data with the greater public. Researchers from all over the world utilize NOAA data, promoting scientific advancement and innovation from data tools that originated from the Deepwater Horizon disaster.
For more information about these tools please explore