
Keeping up with technology is no small task. It seems like every month our smartphone software is out of date or there are some big updates happening on the computer. Nowadays, many smartphone apps will automatically refresh themselves with the most recent version. These range from small security fixes to major updates with a new look or feel that can catch users off guard. Just like any other technology, NOAA tools need to be updated so our work can continue to go as planned.
Updating NOAA’s Environmental Response Management Application (ERMA)
The Environmental Response Management Application (ERMA®) is an online mapping tool that integrates both static and real-time data, such as Environmental Sensitivity Index (ESI) maps, ship locations, weather, and ocean currents, in a centralized, easy-to-use format. It is used by emergency responders during oil spills, hurricanes, and other disasters to store and display important data on online maps.
In late October ERMA rolled out a major update that end-users may not have noticed because it mostly impacted how ERMA processes data on the backend. However, sometimes subtle changes are incredibly important.
Since ERMA’s creation 12 years ago the application has supported thousands of users and data sets, hundreds of responses, and countless training drills on the same underlying technology. Over these years, ERMA continued to build and update with patches, but started reaching the limit of what it would be able to provide without an upgrade.
So over the past year, the ERMA team worked to update the underlying technology while changing some of the ways ERMA functions at its core. With the new technology, ERMA will be able to provide the tools and support necessary as a common operational picture (COP) for NOAA and the U.S. Coast Guard during disasters for many years.
What These Updates Have Accomplished
One key change separated the user interface (UI) code from the server code. This eases updates to the different open source technology that drives each component while reducing the dependencies that created challenges in the past.
Additionally, ERMA updated its application programming interface (API). The API is leveraged in many ways, but one important function allows trusted data providers to automatically update data in ERMA. Applications like the Data Integration Visualization Exploration and Reporting (DIVER) tool, ResponseLink, and the National Environmental Satellite, Data, and Information Service (NESDIS) program leverage ERMA’s API to keep their data current.
Listening to Users To Make ERMA the Best it Can Be
Along with the backend updates, the ERMA team was able to provide users with new functionality requested by users. Here are some of the key updates now available within ERMA:
ERMA Dashboards
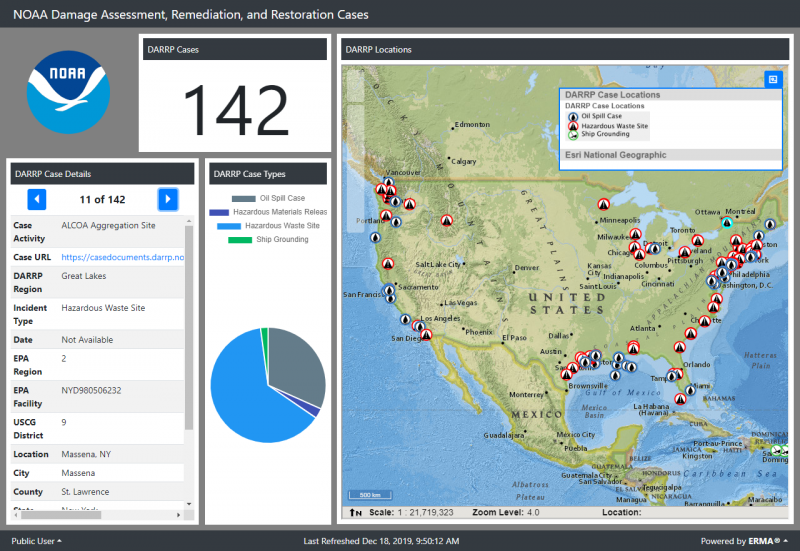
In partnership with the NOAA Marine Debris Program, the ERMA team developed the biggest end-user enhancement, “Dashboards.” Dashboards are a quick way to visualize data metrics from geographic information. They can be customizable, able to focus on a specific data set, larger project, or response effort.
Data managers can create new dashboards that include a slimmed-down ERMA map, data details that can be flipped through, statistical metrics, and charts. All components of the dashboard can be tied to the map so when a user moves the map, the data and statistics being showcased are updated to reflect the view within the map window.
Dashboards are accessible at the top of the ERMA window near the search bar. When clicked, a new window opens showing the available dashboards. Dashboards are particularly useful during hurricane response operations to help track debris targets. Below is the Damage Assessment, Remediation, and Restoration (DARRP) Cases dashboard, showcasing different kinds of marine pollution cases. You can see both where cases are ongoing, and what kind of pollution they represent.
Updates to Add Map Data:
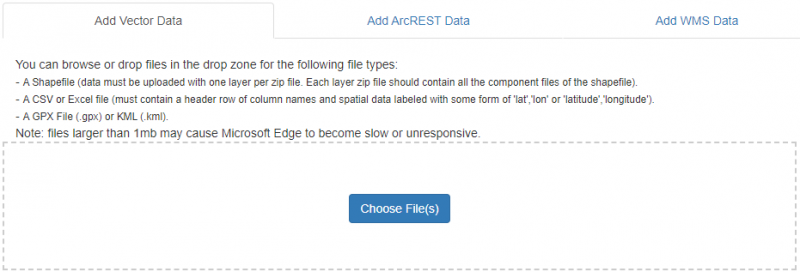
Last year ERMA started allowing users to add their own data to the map view. This is done through the Add Map Data Tool toward the top right of the application. This tool opens a dialog that has been reorganized in a tab format to support files and map services.
With this update, ERMA expanded the file types that it can display on the map. It now supports Excel (XLSX), comma-separated values (CSV), GPS Exchange Format (GPX), and Keyhole Markup Language (KML) file types in addition to the already-supported shapefiles. These data layers appear in the table of contents, but are only visible to the user and are not persistent. When the session is closed the data layers are removed.
Layer Filtering Improvements
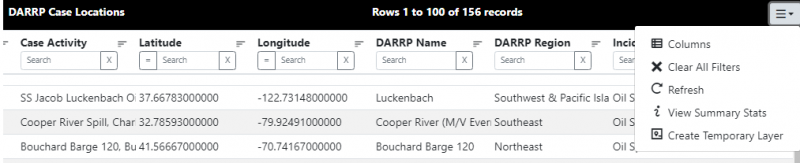
Improvements were made in both the Layer Query Tool as well as the View Data Table. In both windows, users can now filter or sort individual columns and search for records. Users can then add the filtered data to the map, which is not shared with the larger user community.
In the menu panel at the top right, more choices are available that can hide columns, view summary stats on the data, or create a temporary layer. Furthermore, the URL of the query maintains all choices made, enabling users to share the URL to other users to see the query or to return to the query results without having to rerun the query.
Time Slider Updates
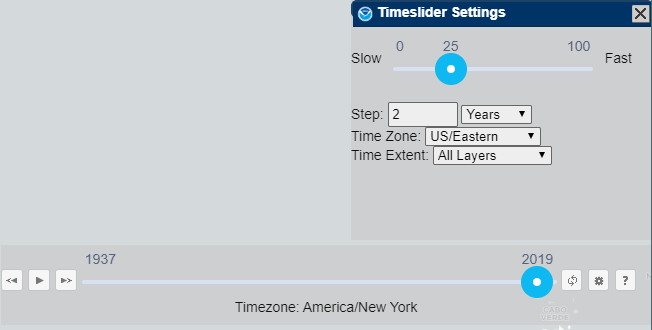
An additional enhancement was to refine the way users can adjust the time slider to see the data over time better. Instead of ERMA deciding the appropriate time step, users can now set a time step and unit (minutes, hours, days, months, or years). There was also a fix to account for leap years. Time-enabled layers have a small clock beside them in the table of contents ![]() . Take a look at the time slider using the Spill locations by year in Northwest ERMA.
. Take a look at the time slider using the Spill locations by year in Northwest ERMA.
Keeping NOAA Tools Up to Date
It takes a lot of work to keep technology working. The behind-the-scenes initiatives carried out by NOAA experts help ensure that ERMA runs smoothly and is ready if disaster strikes. These updates are a huge step in ensuring ERMA adapts, evolves, and continues to be a trusted tool for NOAA, the U.S. Coast Guard, and our other partners well into the future.