
This week, we’re taking a closer look at what sensitivity mapping is, how it’s used, and why it’s so important. A snapshot of the resources in a specific area, sensitivity mapping can be a valuable tool both in and out of the spill response community. Our latest blog takes you through the process of using sensitivity mapping to prioritize response activities during an oil spill.

Oil spills are by definition chaotic events. Conditions often change rapidly as the oil moves into the environment and is subject to currents, waves, weather, and whatever is in its path. When time and resources are limited, responders need sound science to make informed decisions to minimize impacts to natural resources, and the communities and economies that depend on them.
NOAA scientists must also quickly determine what samples and data to collect to understand exposure and injury to natural resources. To maximize efficiency for both response and assessment, NOAA experts use Environmental Sensitivity Index (ESI) maps during oil spills to zoom in on those resources that are most at risk.
ESI maps provide a concise summary of coastal resources that are at risk from oil spills, including birds, shellfish beds, sensitive shorelines, and public beaches, parks, marinas and archaeological and cultural sites, among others. The maps show where habitats and species are found, highlighting seasons, key life stages, concentrations, and their vulnerabilities. They also identify recreational features like parks and marinas.
This provides NOAA scientists with critical information to prioritize their response and assessment actions. There is a brief window of time after a spill to gather scientific information, so it’s important to know what animals, habitats, and human uses are at risk and which are not.
To illustrate this concept, let’s pretend that a ship sank and spilled oil offshore of Alligator Harbor, Florida in the middle of August. Our initial questions would include: What got spilled and how much? Where will it go and what will it hit? What damage will it cause and how can the effects be reduced?
One of the key tools to access is the ESI map.
1. Access the Environmental Response Management Application (ERMA®) online and find the ESI Map for Alligator Harbor, Florida.
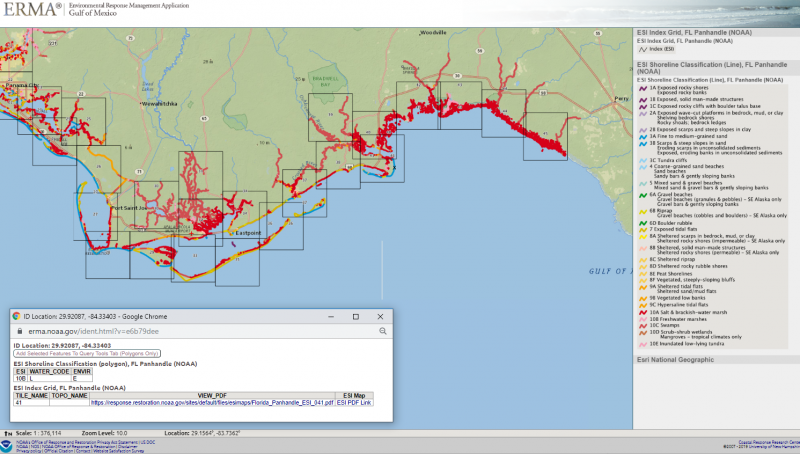
The Environmental Response Management Application (ERMA) is an online mapping tool that integrates static and real-time data — such as ESI maps. Much of the environmental data hosted on ERMA is available to the public. ERMA is broken up into regional portals, so we would open ERMA Gulf of Mexico. ERMA makes it easy to zoom in on Alligator Harbor and pull up ESI maps for the area.
 2. Now let’s see what is the sensitivity to oil of habitats that are in the area. How does it overlap with where the oil is, and where it is going?
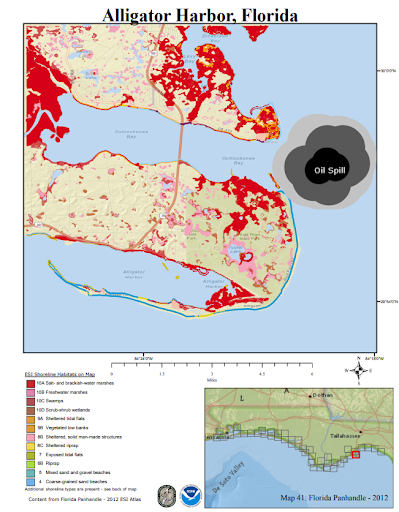
On the ESI maps, shorelines are color-coded to show their sensitivity to oiling or cleanup activities. Some habitats are more sensitive than others.
The ESI Shoreline Habitat Map for Alligator Harbor shows that it has over five square miles of saltwater marsh, shown in red. These marshes are very sensitive to oil exposure, making them a high priority.
NOAA scientists would use this map to identify which areas to prioritize, and where to send scientists for data collection.
These maps also help NOAA responders advise the U.S. Coast Guard about which areas need the most protection. This will guide protection actions, like deploying booms, and cleanup actions tailored for specific habitats.
3. What species are here during the middle of August?
The ESI Map shows us that Alligator Harbor is home to 84 fish species, 53 bird species, seven kinds of turtles, three rare plant species, American alligators, Gulf salt marsh snakes, bottlenose dolphins, and West Indian manatees. It also provides information about how abundant a species is, what months of the year they may be present and their yearly lifecycle.
This information is critical so scientists know what species are at greatest risk, and which ones not to look for. Let’s look at sea turtles found in Alligator Harbor as an example:
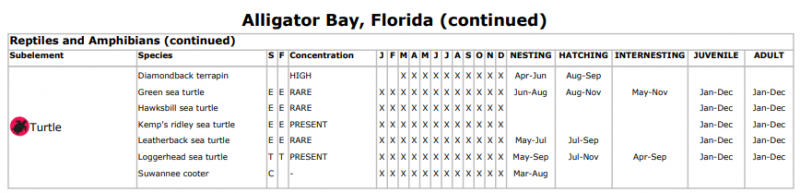
There are five species of sea turtles found here. This table shows us that not only are all five species found in Alligator Harbor during the month of August, but green sea turtles would be nesting and leatherback and loggerhead sea turtles nests could be hatching and crawling from the beach to the ocean.
Hatching sea turtles are at an increased risk of getting trapped in oil slicks, and cleanup operations can inadvertently scare nesting turtles away from beaches or harm eggs buried under the sand. Having this valuable information ready beforehand helps spill planners and responders prioritize species to protect them from oil and identify appropriate cleanup and assessment approaches.
4. What resources are protected or require special attention?
Legislation like the Endangered Species Act, the Marine Mammal Protection Act and the National Marine Sanctuaries Act place additional protections and considerations for natural resources, which must be taken into account during oil spills. ESI Maps show where endangered species can be found, the boundaries of National Marine Sanctuaries, Essential Fish Habitat, and other information critical to protecting vulnerable species and habitats.
Another function of ESI maps is allowing responders to call in species experts early in the response. Take marine mammals for example:
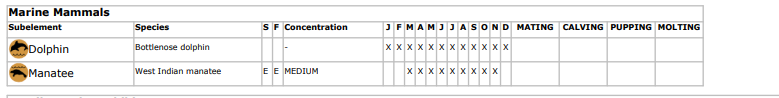
Manatees and bottlenose dolphins are both found in Alligator Harbor in August, but these two species have different considerations. Dolphins are a NOAA trust resource, while manatees are managed by the U.S. Fish and Wildlife Service, so experts from both agencies need to be called in. Oftentimes ESI Maps even provide local points of contact for stranding networks or other local resources available to help injured wildlife.
With the data provided in ESI Maps, responders have the information they need to call in species experts and consider protected species from the very beginning of oil spill response.
ESI Maps Help Prepare Communities For Disasters
ESI maps are rich with complex information that can help communities prepare for disasters. ERMA ensures that they are online and accessible for the many federal and state emergency responders that rely on them. Prepared in advance of a disaster, ESI Maps can provide critical information to help local responders and the U.S. Coast Guard to prioritize needs and make decisions based on sound science.
While the scenario we walked through was hypothetical, the data available in the Alligator Harbor Environmental Sensitivity Index Map is very real. If a disaster were ever to strike this area, local responders are equipped with the information to lead a coordinated response.
Visit the resources below to learn more: