
Valerie Cleland and Ian Hanna are graduate students at the University of Washington School of Marine and Environmental Affairs. This blog post reflects their master's capstone project. The views expressed in this post reflect those of the authors and do not necessarily reflect the official views of the National Oceanic and Atmospheric Administration (NOAA) or the federal government.
You could call it a black gold rush. Technological advances like hydraulic fracking have made harvesting oil profitable in the U.S. again and changed the global petroleum market. For decades, the U.S. was dependent on oil imports and banned crude oil exports to protect domestic reserves.
This changed in 2015, when the U.S. lifted the 40-year export embargo on crude oil and gave the oil industry access to the global crude oil market. Just three years later, the U.S. is now the third largest crude oil exporter. Much attention has been given to the economic implications of this massive shift, without much thought to potential changes in oil transportation. Our question is this, how has crude oil transportation changed since the crude oil export ban was lifted in 2015?
Ian Hanna and I were tasked by NOAA’s Office of Response and Restoration to answer that question for the West Coast Region during our master’s capstone project for the University of Washington School of Marine and Environmental Affairs. We found that while there has been a small increase in oil movement along the West Coast, other regions of the U.S. have seen greater increases in crude oil exports.
When the U.S. lifted a 40-year ban on crude oil exports in 2015, it was unclear how, or if, crude oil transportation would change. Today, crude oil is being sent to places like Argentina and South Korea and creating new crude oil shipping patterns. With the U.S. exporting a record of 8.3 million barrels per day in April 2018, we are now one of the world’s largest exporters of crude oil. This has implications for regional and national oil spill prevention and preparedness.
Total Exports 1993-2017

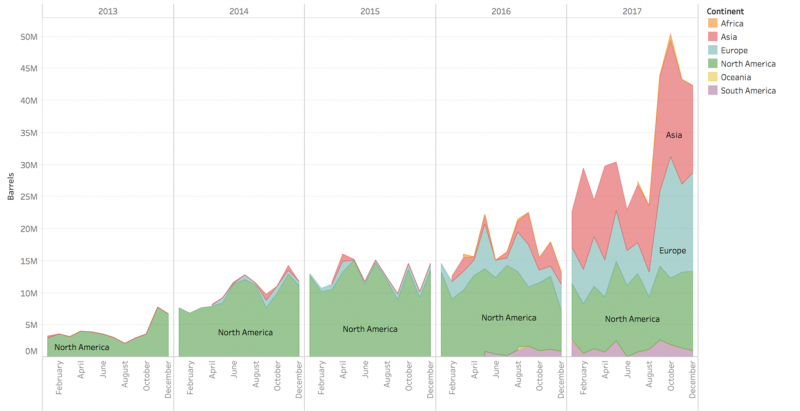
U.S. Oil Exports by Destination Continent
Agencies and reports that deal with crude oil exports almost exclusively look at changes from a national perspective. However, with so many issues facing emergency preparedness personnel at regional levels, it is imperative to prioritize and understand the impacts of increasing crude oil exports.
To address changes in crude oil transportation, we took a two-pronged approach. First, we wrote a survey that aimed to measure the human perception of change and oil spill risk. This 21-question survey was sent to people across the industry to get an idea of how stakeholders thought things were or were not changed. Second, we paired this data with crude oil export data from the International Trade Commission (ITC). While this data is primarily collected for tax purposes, it provides a regional and national snapshot of oil movement and gives a quantitative indication of the significance of changes to oil export routes.
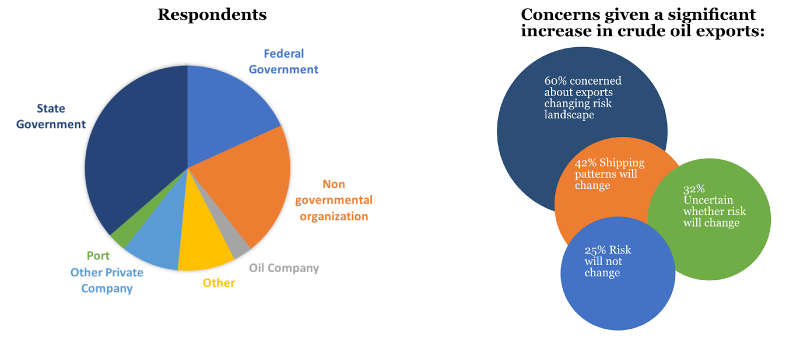
From the survey, we learned that approximately 80 percent of participants had seen no policy change since the crude oil export ban was lifted in 2015. Assuming an increase in exports, 60 percent were generally worried about increased risk of oil spills and others worried about public backlash due to concern, new shipping patterns, and unknown risks. While 42 percent thought that changing patterns in shipping may increase the chance of an oil spill, 25 percent disagreed that changing shipping patterns increase oil spill risk. About 50 percent of respondents were unsure about the future of increasing exports, indicating uncertainty about what changes may take place.
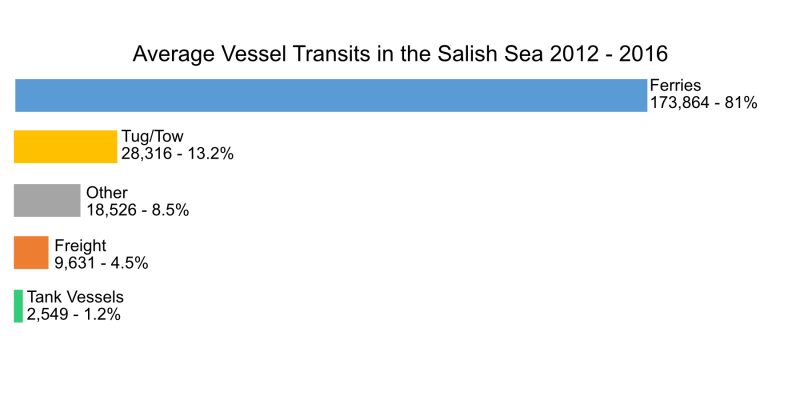
With regards to the Trans Mountain Pipeline Expansion Project — a proposed extension to the existing Kinder Morgan pipeline, which carries crude and refined oil from Alberta, Canada to the West Coast of British Columbia — 63 percent believe that an expansion may increase oil spill risk in the Salish Sea region (note: the final decision on whether the Kinder Morgan pipeline will be announced on May 31, 2018).
Beyond the proposed Kinder Morgan pipeline, people are concerned about future Arctic shipping and transporting crude oil by rail, “crude by rail exports could derail in difficult to respond to locations and cause significant impacts to waters of the State.” People shared ideas on how to mitigate oil spill risk in the region with suggestions like, “continuous improvement of measures already in place. Many improvements have been made in the past 25 years. We need to ensure we never ever become complacent and we make further appropriate cost beneficial improvements when identified”.
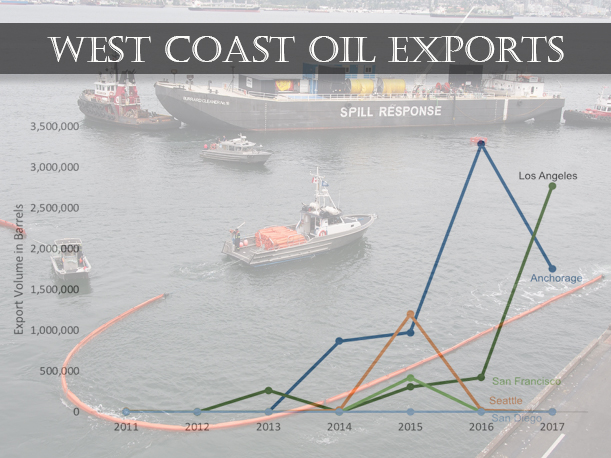
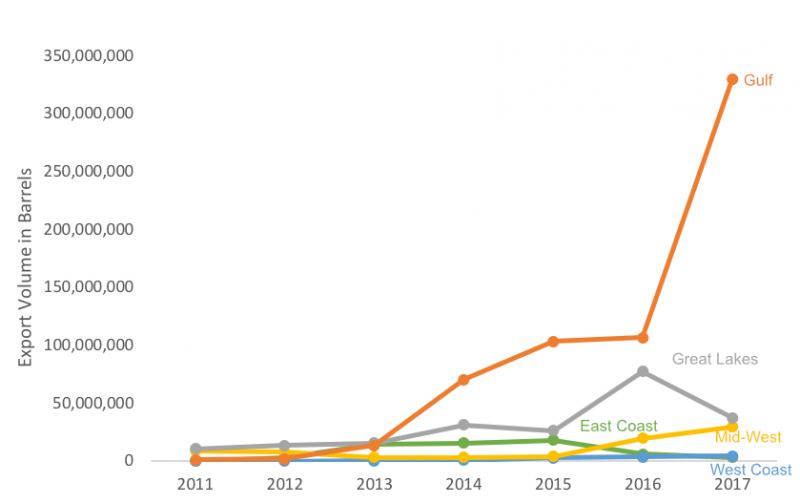
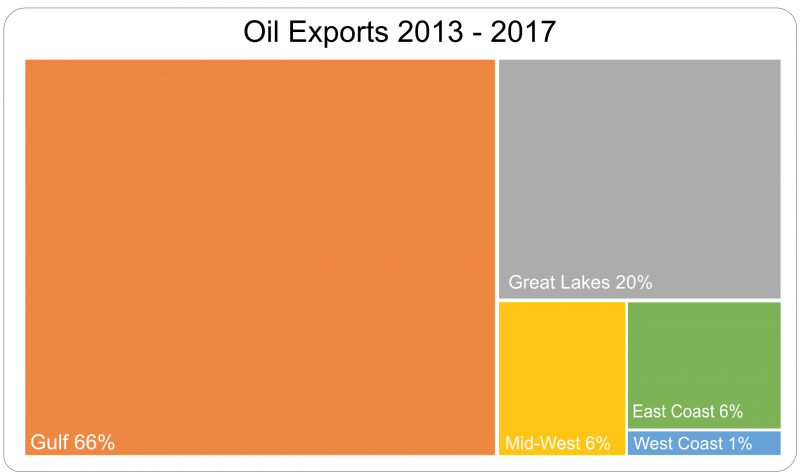
From the crude oil export data, we learned that the majority of exports of crude oil, 66 percent, leave from the Gulf of Mexico region. The smallest proportion, about 1 percent, comes from the West Coast. While less so than other regions, the West Coast region exports are still increasing, at a rate of one million barrels a year since 2013.
When we isolated the specific routes that exports take leaving the West Coast, no trend emerged. Exports are increasing on a regional scale but no particular route stands out as more significant. Exports from the West Coast at this point seem random and are likely opportunistic or exploratory. Time and experience will reveal the most profitable routes for West Coast exports. However, barring any unforeseen changes in the supply or price of oil, we expect the upward trend to continue.
With a growth in exports, alongside the proposed Kinder Morgan pipeline in British Columbia, Canada, oil spill preparedness and response must adapt.
We recommend that a high level of attention is maintained in the Salish Sea region, due to potential changes in both the U.S. and Canada that would impact oil spill risk in this area. This monitoring effort extends to the Aleutian Islands since they are particularly sensitive to oil spills and situated along a major transportation corridor. The great circle route (shortest distance on a globe) between the Pacific Northwest and Asia passes through the Aleutians and it is the most frequented part of the Arctic Region. As this area is already dense with shipping traffic, any increases in traffic, namely crude oil tankers, makes the region more vulnerable to oil spills. While no crude oil is being shipped via this route currently, an upward trend in West Coast exports increases the future possibility of crude oil tankers using this route.
Like the rest of the Arctic, any crude oil tanker spill in the Aleutians would be catastrophic because it is remote lacking in response infrastructure, environmentally sensitive, with harsh weather that makes cleanup difficult. In addition to monitoring changes, further investment in infrastructure and response planning for the Aleutians is necessary.
The more we understand about how oil spill risk is changing on a regional scale, the better prepared we can be to ensure that policy is aligned with current crude oil transportation. Continuing to examine, monitor, and assess changes in exports is an essential piece to understanding how oil spill risk may be changing and allow us the information to work to prevent an oil spill rather than clean one up.
Special thank you to Mary Baker and Doug Helton with NOAA’s Office of Response and Restoration for their help and guidance on this project.