
This week, NOAA’s Office of Response and Restoration is looking at the impacts of pollutants on wildlife and endangered species. We’ll explore tools we’ve developed to map sensitive species and habitats, how marine debris endangers marine life, how restoring toxic waste sites improves the health of wildlife, and the creation of a mobile wildlife hospital.
Scenario: You’re a state natural resource manager for a coastal salt marsh and just got a call that a tanker spilled thousands of gallons of crude oil that is now heading for your shores. You have maybe two hours before the oil starts washing up on your coast.
What do you do?
How do you determine what animals may be in jeopardy?
How do you prepare a response plan to protect those species?
Anticipating the information state and federal staff need when responding to an oil spill or other environmental hazard is what we do. In addition to providing scientific support, we’ve developed guides and databases for resource and response managers to use in those early, sometimes chaotic, hours of an incident.
One of the tools we’ve developed is our Environmental Sensitivity Index maps. The maps and data show where species are found, along with information about monthly seasonality, breeding and life stages occurring, concentrations, and qualifiers that indicate why a species occurrence may have increased vulnerabilities.
In responding to hazardous materials released into the natural environment, it’s important for responders to know that some animal species are especially vulnerable to spills and cleanup activities. Animals and their habitats tend to be most at risk from oil spills when:
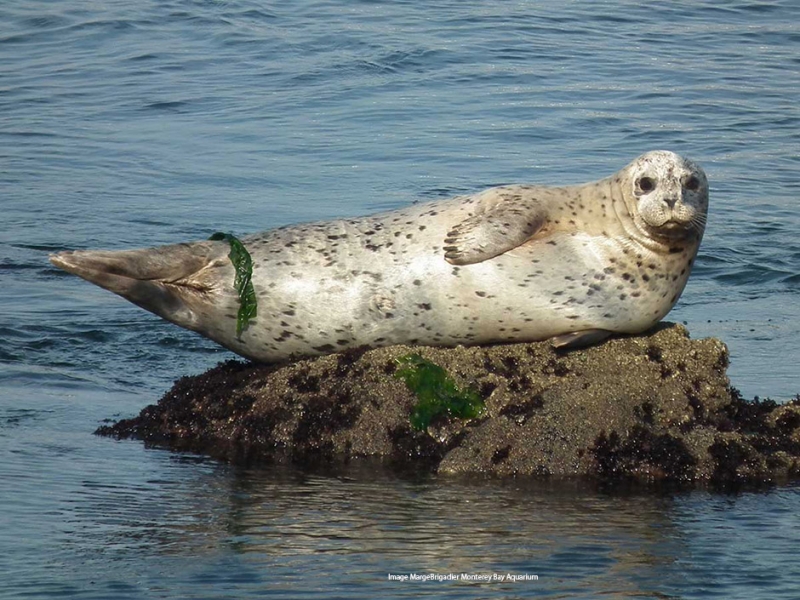
- There are many individuals concentrated in a small area, such as a seal haulout area or a bay where waterfowl concentrate during migration.
- Early life stages such as seabird rookeries, spawning beds used by anadromous fish, or turtle nesting beaches are present.
- Oil affects areas important to specific life stages such as foraging or over-wintering sites, or migration routes
What information is in an Environmental Sensitivity Index?

It’s important for emergency responders to know as much as possible about what species may be adversely affected by a hazardous spill. Our Environmental Sensitivity Index, or ESI, maps include critical information on:
- Rare, threatened, endangered, and species of special concern
- Commercial and recreational wildlife
- Areas of high species concentration
- Areas where sensitive life-stages or activities occur
In addition to information on wildlife resources along the nation’s coastlines, the indexes provide detailed information on shorelines and on how people use the natural resources present.
How we gather biological information
The Environmental Sensitivity Index biology information is a compilation of existing data and regional knowledge. A list of all threatened or endangered species in the area is amended with other regional species that are of local concern, or are particularly vulnerable to oil.
Once an initial species list is created, the search for existing species distribution and seasonal information begins. This may come from state or local government, academics, non-profit organizations, or non-affiliated experts. A typical ESI atlas will have upwards of 100 contributing expert sources and documents.
The ESI challenge is how best to compile and integrate this diverse data to create a product useful to responders who need to quickly assess an area of potential oil impact. As data is processed, the contributing experts are asked to review the species distribution and attributes to assure the data is presented accurately and as intended.
Because there are often multiple sources for a single species, this is particularly important in order to assure the experts are comfortable with how their information will be presented. This is a collaborative process during which additional species may be identified and added to the species list, and additional resource experts are identified. Reviews continue through the finalization of the ESI data and tables.
How to access the data
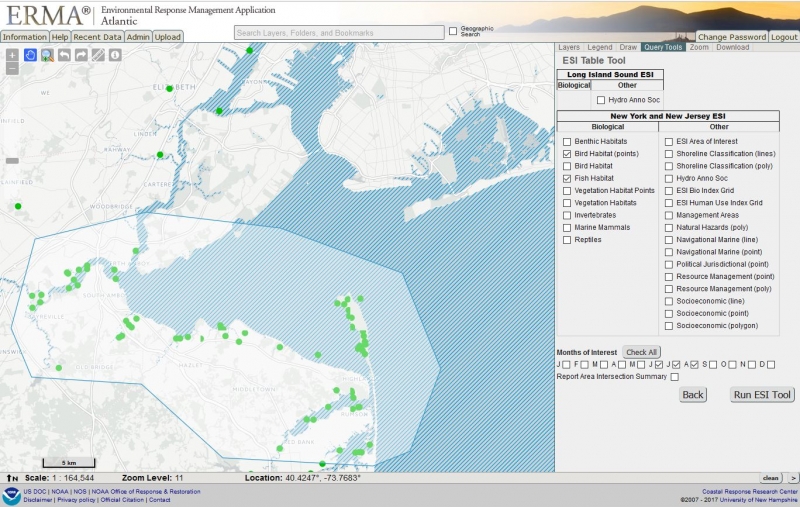
The Environmental Sensitivity Index data is designed to work within a geographic information system. The data can also be accessed publicly through a variety of free tools including our ESI toolkit and many of our Environmental Response Management Application, or ERMA®.
Making decisions during an environmental crisis sometimes requires difficult trade offs. Having this valuable information ready beforehand helps spill planners and responders prioritize areas to protect from oil and identify appropriate cleanup strategies.
Read more stories in our series on the effects of pollutants on wildlife:
- A Legacy of Industry and Toxins in Northern New Jersey: Striped Bass and Blue Crab
- How Marine Debris is Impacting Marine Animals
- Oils Spills and Animal Rescue in Alaska and Beyond
Jill Petersen, ESI program manager, contributed to this article.