
On April 20, 2020, NOAA will join our state and federal partners in observing 10 years after the Deepwater Horizon oil spill — an incident that resulted in the tragic loss of human life and an unprecedented impact to the Gulf’s coastal resources and the people who depend on them. From March 30 to April 20, tune in as we go back in time to the day of our country’s largest marine oil spill, what’s happened since then, and how we’re better prepared for future spills. In our latest blog, learn more about how Deepwater Horizon helped improve NOAA's oil modeling capabilities.
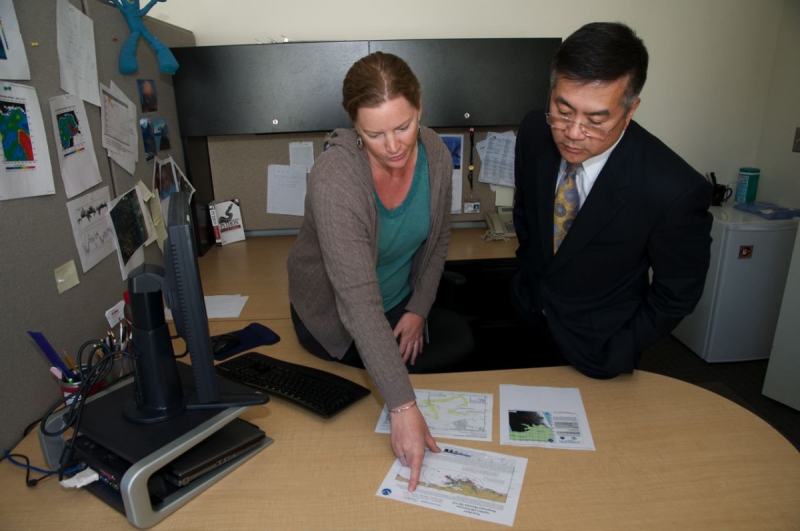
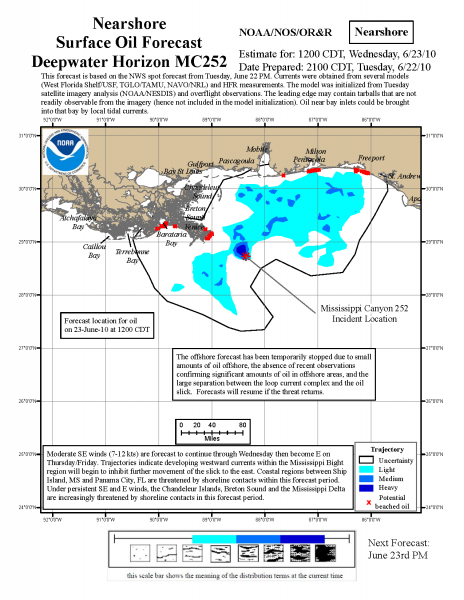
When the Macondo well blowout happened 10 years ago, OR&R specialists used their workhorse oil spill trajectory model, GNOME—first developed in the late 90s—to estimate where the oil from the gushing wellhead would end up. Because of the continual release of oil—tens of thousands of barrels each day, over nearly three months—they had to prepare hundreds of forecasts as more oil entered the Gulf of Mexico each day, was moved by ocean currents and winds, and was weathered (physically, biologically, or chemically changed) by the environment and response efforts. They also needed to be sure that the maps were understandable to those who would be studying them.
In addition to using GNOME to predict the immediate movement of surface oil slicks, the OR&R scientists used a related OR&R tool, TAP, to help them complete statistical analyses, in which they ran the GNOME model hundreds of times, based on historical data for the wind and currents, to determine the probabilities of impact to different areas of the coast.
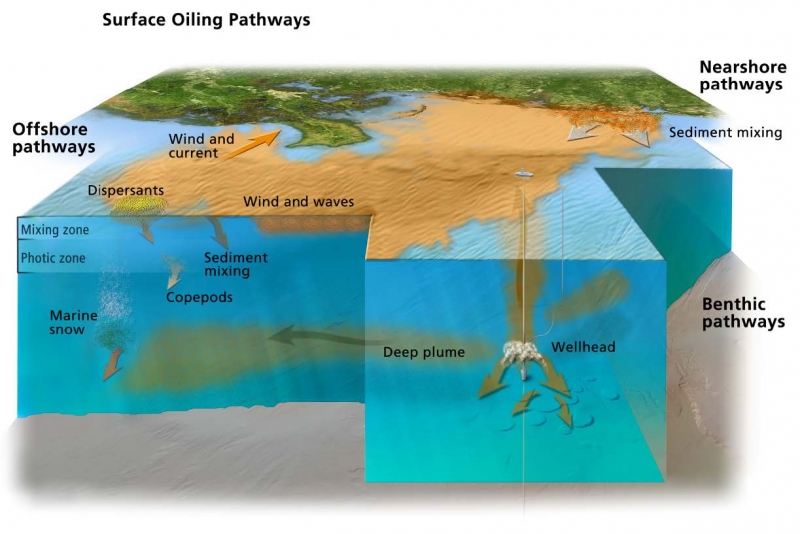
OR&R’s scientific support for most oil spills tends to be focused on oil at the surface, but this was a very different spill. Oil was spewing from about 5,100 feet below the surface, at a flow rate that was highly difficult to estimate. OR&R had been involved in subsurface spills before, such as the explosion and spill from the Ixtoc I oil rig in 1979, however that spill was in comparatively shallow waters. Therefore, modelers also provided estimates on the movement of dispersed oil plumes deep within the water column to support sampling and detection efforts.
In the decade since that disastrous spill, the GNOME development team has used “lessons learned” from the Deepwater Horizon spill to expand GNOME and its related programs into the GNOME Suite—a robust set of oil spill modeling tools to better predict spill movement and behavior.
How has GNOME been further developed?
GNOME can now be used and accessed in multiple ways.The separate, stand-alone oil weathering model, ADIOS®, has been coupled with the oil transport capability of GNOME, allowing users to simulate scenarios ranging from oil budget analyses, to simple drift analyses, to fully coupled oil trajectory and fate.
A new web interface (WebGNOME) provides improved visualization of the trajectory and fate of the oil, such as the amount of oil that is floating on the surface, beached, evaporated, or dispersed over time. Users of WebGNOME can use different basemaps, overlay environmental information, and choose among various color scales for various oil properties (such as viscosity) or bulk oil concentration.
A stand-alone scripting application (PyGNOME) is also publicly available and open source, which better allows users to develop and run more complicated analyses, for example, to automate running the hundreds of trajectories that are needed for statistical analyses, like TAP. This interface was also particularly useful for the multi-year drift simulations that provided information on arrival times of marine debris from the devastating Japanese earthquake and tsunami that occurred in March 2011.
Another important advancement to GNOME has been the integration of an oil spill blowout model developed at Texas A&M University (TAMOC), allowing GNOME to better predict the fate and transport of oil and gas released from subsea accidents. The application of subsurface dispersant during the Deepwater Horizon incident required even greater understanding and tracking of the subsurface oil as the dispersed oil droplets moved in plumes away from the source. It became important to predict where and how the plumes would move in the ultra-deep ocean, and to see how dispersant application might change the amount and properties of the oil reaching the surface and concentrations of oil components within the water column.
GNOME now also offers enhanced output for interaction with GIS systems, making it easier to upload shapefiles and other GIS files into NOAA’s common operational picture, ERMA®. The ERMA online mapping tool serves as a centralized, easy-to-use format to provide spill responders with the data necessary to make informed decisions for environmental response.
Finally, the GNOME development team made all the code open-source through GitHub, creating a community model that welcomes others to use and contribute, providing transparency and encouraging collaboration within the oil spill modeling community.
What’s Next for the GNOME Suite?
Fortunately, large oil spills like the Deepwater Horizon incident are relatively rare. Many of the advancements in the GNOME suite are also applicable for improved prediction oil fate and transport for the more frequent small spills that the U.S. Coast Guard responds to.
Now that the new model framework is complete, development work continues in a number of areas. This includes improved integration of remotely sensed data (e.g., satellite analyses) for spill initialization in GNOME. With a wealth of research funded post-Deepwater Horizon, there are also efforts underway within the larger oil spill modeling community to revisit many of the weathering algorithms used by oil spill models. As new understanding is gained, GNOME algorithms will continue to be updated.
Finally, among the newer spill response tools created within OR&R is CAFE, which provides for rapid review of toxicity and fate information for oil, dispersants, and chemicals. The latest version of CAFE, the newly launched Web CAFE, offers several new features long requested by users of the earlier “desktop” version. In the future, this information might be used to set “levels of concern” within WebGNOME, such as identifying regions within the water column where concentrations of oil constituents might present a threat to specific species.