


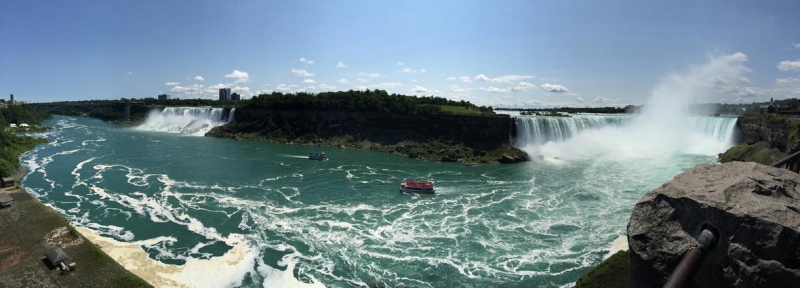
Over 8 million people visit Niagara Falls National Park each year, where Lake Erie flows into Lake Ontario. Mackinac Island, where Lake Michigan meets Lake Huron, is also famous for its horse-drawn carriages and natural beauty.
So what would happen if there was an oil spill at Niagara Falls or Mackinac Island? This possibility is why NOAA develops Environmental Sensitivity Index (ESI) maps to prepare for potential oil spill disasters.
In anticipation of Great Lakes Day, we wanted to show you the maps for two iconic places in the Great Lakes—Niagara Falls, with ESI maps last updated in 1985, and Mackinac Island, with ESIs updated in 2020.
Responders’ Need for Accurate ESI Maps


ESI maps provide concise summaries of coastal resources that are at risk from oil spills—including fish and wildlife, parks and marinas, and shoreline habitats—and then rank their sensitivity to pollution. ESI maps also show responders what resources (like migratory birds) are present at different times of the year.
When oil spills, OR&R scientists need to know or determine five key pieces of information:
- What spilled?
- Where could it go?
- What could it affect?
- What harm could it cause?
- What can be done to help?
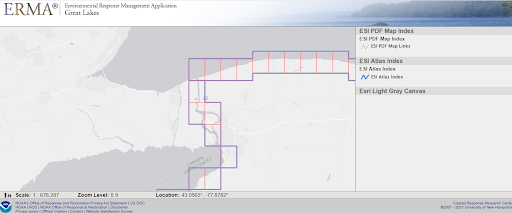
ESIs help with at least two of these questions: what could it affect and what harm could it cause. They also can help with what can be done, by providing information on nearby assets, such as cleanup access points and potential staging areas for response equipment. They are easily accessible online and through NOAA’s Environmental Response Management Application (ERMA®).
Up-to-date ESI maps are critical so responders have accurate information on-hand to best protect the environment. Understandably, ESI maps require a great deal of data and resources to maintain, and are expensive to produce and update. NOAA aims to update ESI maps and data every five to seven years.
To illustrate the difference between the older and newer ESI Maps, let’s compare Niagara Falls to Mackinac Island.
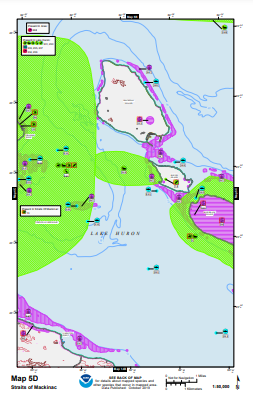
Mackinac Island ESI Maps - Updated in 2020

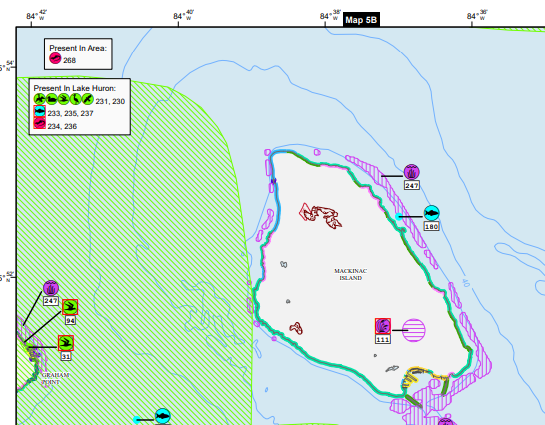
Here you can see a recently updated ESI map for Mackinac Island State Park, located in the Straits of Mackinac. The map provides “one stop shopping,” presenting both the map and information about the natural and human-use resources (e.g., parks, beaches, boat launches) found there.
Zooming in, you can see there are several protected species, including Bald eagles, Lake Sturgeon, Common loon, threatened salamanders, and threatened plant species.
To see all bird species found, responders can use the Species Legend (which shows which times of year those bids are found) or the Map Index for even more detailed information.
Knowing which species live where, and where sensitive habitats are found, as well as when species are present, is important so responders can set priorities to contain the oil spill and protect sensitive areas like nesting habitats for endangered birds.
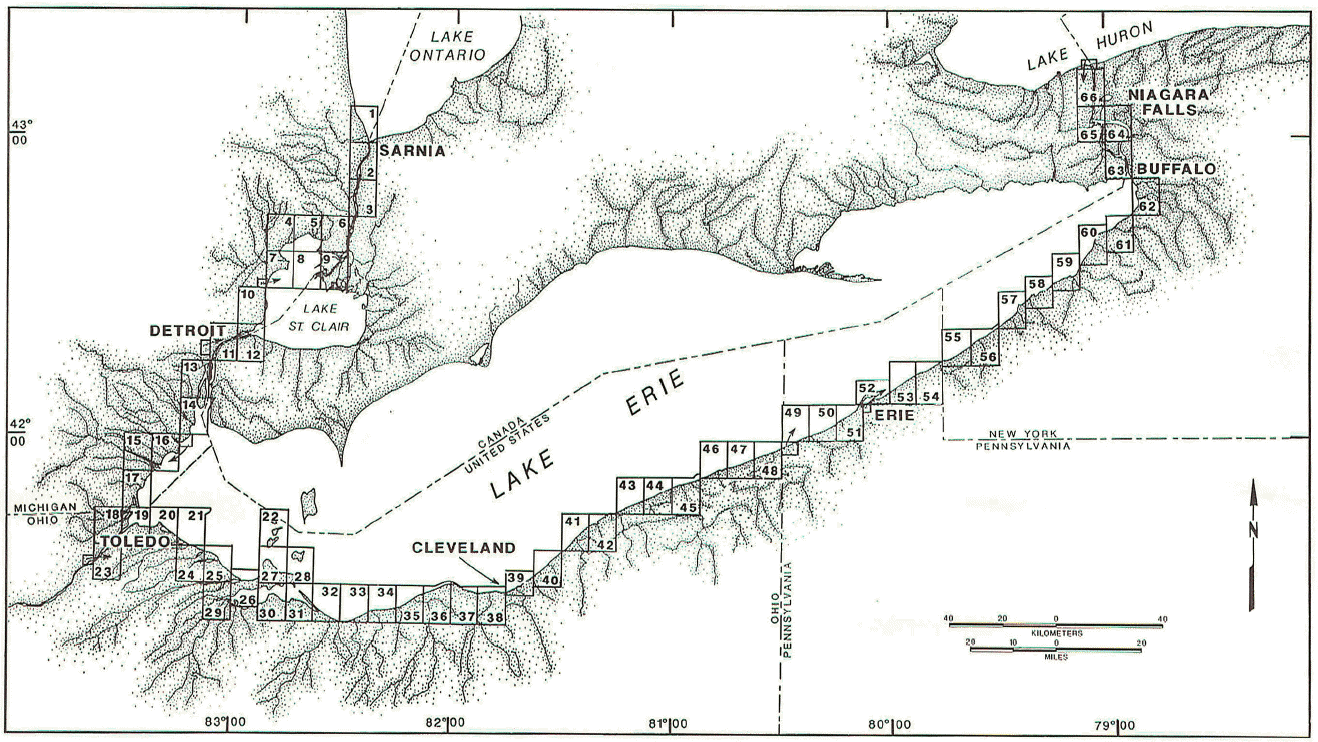
Niagara Falls ESI Maps - Updated in 1985
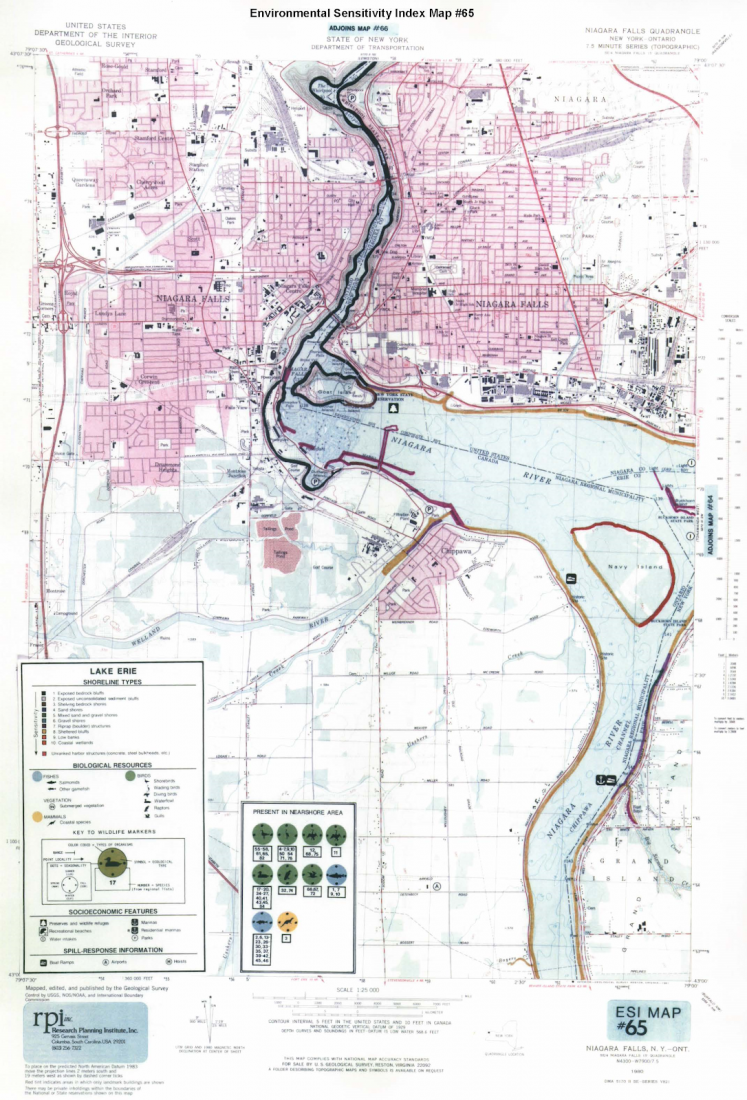
This ESI map for Niagara Falls is part of the ESI Atlas (a heavy, cumbersome binder of large laminated maps) produced in paper version in 1985. The maps have since been scanned as PDFs and uploaded to ERMA so responders can access them more easily.
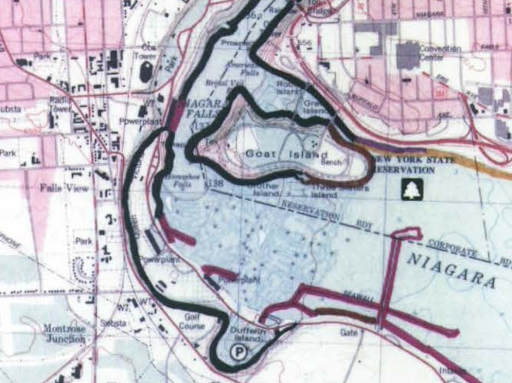
While these older maps do display important information about the natural resources found at Niagara Falls, like the fact that several species of ducks are found here during the summer months, this information is more difficult to understand. Responders need to zoom in very close, then reference a separate Index to learn about the resources at risk.
It’s also very likely that conditions have changed in the last 35 years, which is a concern for oil spill responders.

Advantages of Updated ESI Maps
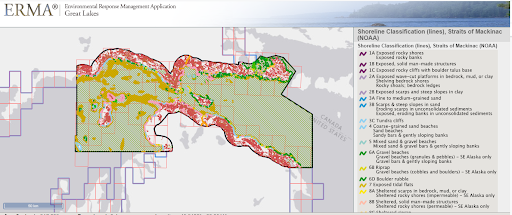
In newer ESI maps, oil spill responders can search a given area to determine the amount and types of sensitive shorelines at risk of oil exposure as well as the different species, including those that are threatened or endangered.
This can be done in both ERMA and traditional geographic information system (GIS) programs. This type of activity isn’t possible in the hand-drawn PDF maps. In addition, the new ESI maps that are PDFs are georeferenced, layered PDFs.
ESI maps have a lot of information, which can be a little bit overwhelming. With the layered PDFs and in the ERMA or GIS environment, users can turn layers on and off, isolating the details of interest. For example you could view shoreline types and bird habitats, or just shoreline types. These features are incredibly useful tools that allow for easy extraction of desired information.
Two Recent Updates in the Great Lakes

In March 2020, using funding provided through the Great Lakes Restoration Initiative, OR&R completed updates to ESI maps and data for two Great Lakes regions—the Straits of Mackinac (where Mackinac Island is located) and the St. Clair-Detroit River System.
These busy shipping routes also contain two 20-inch diameter pipelines that carry nearly 23 million gallons of oil per day. These areas are habitats rich with managed natural areas and preserves, sensitive wetlands, and numerous threatened and endangered species.
OR&R recently established a new agreement with the U.S. Coast Guard to update another set of Great Lakes ESI maps, those for the St. Marys and St. Lawrence rivers. This is great news—but many Great Lakes regions are still in need of updates.
Protecting the Great Lakes through Preparedness
ESI maps are rich with complex information that can help Great Lakes coastal communities prepare for disasters. As downloadable files or as layers within ERMA, they are online and accessible for the many federal and state spill responders that rely on them.
A crucial component of the maps is whether they are current enough to adequately protect the resources they are designed to protect.
As NOAA works toward updating ESI Maps for the Great Lakes region, these important tools can revitalize access to critical information for responders and the U.S. Coast Guard to prioritize needs and make decisions based on sound science. For future ESI updates in those border areas where the Great Lakes shorelines lay in close proximity to one another (e.g. St. Marys, St. Clair/Detroit, Niagara, and St. Lawrence Rivers), NOAA plans to explore partnering with the Canadian government.
Canada uses a classification schema similar to the U.S. ESI schema, such as the shoreline classification system for the province of Ontario. The two countries have worked together over the years to create an international spill response framework, through the CANUSLAK and other agreements. Coordinating with the Canadians for future ESI updates along our shared borders will be a priority.
Learn more about Great Lakes Environmental Sensitivity Index (ESI) maps:
- NOAA’s Office of Response and Restoration website
- NOAA’s Emergency Management Response Application (ERMA) - Great Lakes