
This week, we’re taking a closer look at what sensitivity mapping is, how it’s used, and why it’s so important. A snapshot of the resources in a specific area, sensitivity mapping can be a valuable tool both in and out of the spill response community. In this latest blog, learn more about an important partner in sensitivity mapping and the collaborative effort to map the East Coast after Hurricane Sandy.
NOAA Office of Response and Restoration’s Jill Petersen has seen Environmental Sensitivity Index (ESI) maps grow and change from the hand drawn paper copies that were the earliest ESI maps, to the ever-growing geographic information system (GIS) format we have today. But perhaps the greatest period of change for ESI maps came right at the heels of Hurricane Sandy.
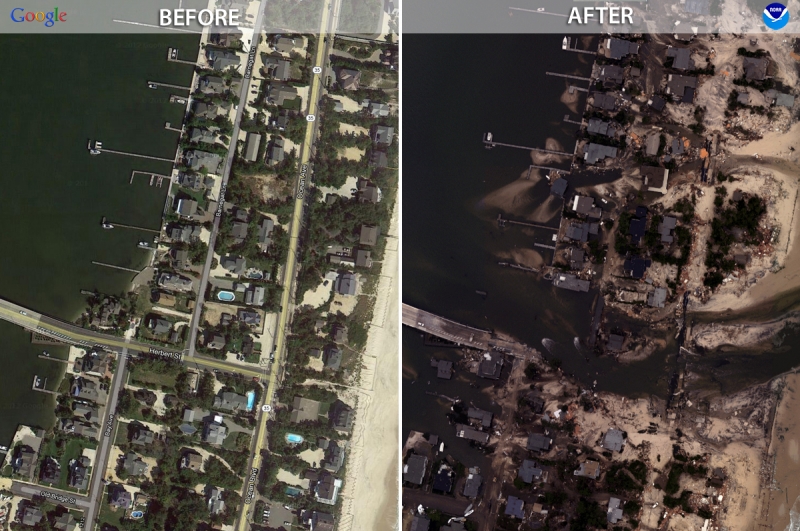
In 2012, Hurricane Sandy brought devastating winds and flooding to the Atlantic coast. In some parts of New Jersey, flood waters reached nearly 9 feet. Up and down the East Coast, this massive storm reshaped the shoreline — creating a need for updated maps to reflect these changes.
“When Sandy happened, we had to map the entire East Coast in three years,” Petersen said. “It was a huge task, and we couldn’t do it alone.”
Collaborating Across NOAA
To meet the demands of the East Coast atlases, Petersen and her team brought new contractors on board to help carry the load. Some of these contractors were private companies outside of NOAA, but one of the new collaborators was NOAA’s National Centers for Coastal Ocean Science (NCCOS) — an office within the National Ocean Service that delivers ecosystem science solutions to sustain thriving coastal communities and economies.
NCCOS and its predecessors have assisted with ESI projects in the past by processing and providing data for ESI biology elements such as fish and invertebrates. With funding from Congress, OR&R recruited a team from NCCOS’ Marine Spatial Ecology Division.
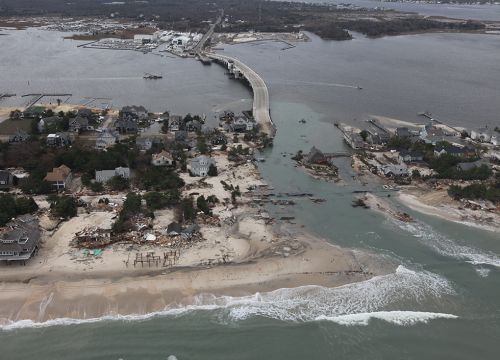
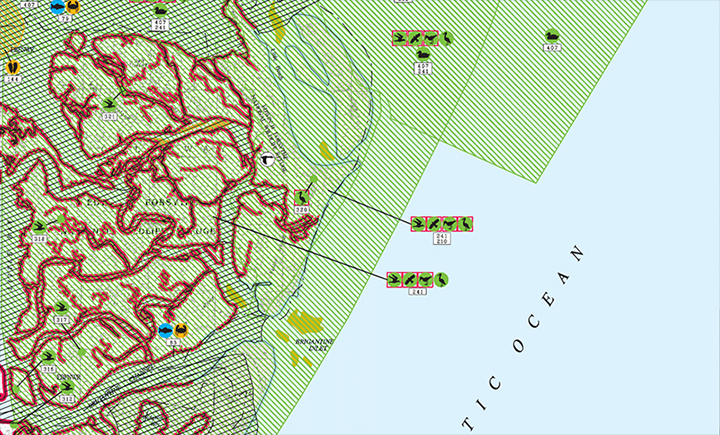
“There was an urgency to get the shoreline flown to capture the changes that occurred in the shoreline after Sandy,” said Dan Dorfman, marine spatial ecologist with the Marine Spatial Ecology Division Biogeography Branch. “Our part [NCCOS] was more focused on the biology and human use layers.”
The team from NCCOS went to subject matter experts to find the biology and human use information they needed — from the seasonality and breeding of different species, to other special elements involved on a regional level. Data was pulled from a variety of sources — including state governments, regional agencies, and nongovernmental organizations — in search of the most credible and up-to-date information available.
“We would do a site visit and talk to people who were there to get a better idea of the area,” said David “Moe” Nelson, marine biologist. “We would combine human resources with applicable literature, often using data tables and other items that help flesh out the picture. The biggest challenge is aggregating all this data and fitting it into the ESI database format, and how to get all the biology information into a common form.”
Before the information could be sent to OR&R, it had to be synthesized into a common form to be reviewed and integrated into the ESIs. Throughout the process of data collection and integration into a GIS format, Petersen and the team from NCCOS began to recognize other areas to grow the ESI maps.
Leaps and Bounds in Sensitivity Mapping
As the team worked to collect the data and map the East Coast in just three years, they also began noticing opportunities to add more information — providing additional value to the ESI maps.
“There was a lot of interest in looking at things to include in the ESI maps, and the changes in how we did them,” Nelson said. “One thing that came into play was the expected storm surge, and together with the National Weather Service we came up with expected storm surge for hurricanes category 1-5. So there was this recognition that ESIs were valuable for not just oil spills, but also hurricanes.”
Another change that occurred around the same time as the ongoing mapping of the East Coast was the extension of the offshore component to the maps. As the spatial footprint of the study areas expanded to five miles out from any tidal waters, new data had to be recorded for this area as well.
“For the biology layers, we also included a new field for qualifiers. For a given species, we added a text field for why it’s important — if the area is a nursery or spawning area that could be a mapping qualifier,” Nelson said.
A Continued Partnership
In the years since the completion of the East Coast atlases, NCCOS has continued to be an important partner in sensitivity mapping. In addition to helping OR&R maintain the ESI atlases, NCCOS has also used the maps for their shorelines.
“We’ve developed a couple digital atlas projects, and the ESI shoreline characterization is one of the best of its type. And we’ve used the shoreline as a feature in other things,” said Chris Clement, physical scientist.
The team from NCCOS was also integral in updating the guidelines for the sensitivity maps. These guidelines outline the basic elements of sensitivity mapping, provide a guide to the collection and synthesis of data, and define the data structure for a digital ESI application using GIS technology.
“During that time after Sandy, it became pretty evident where the holes were in the existing ESI guidelines. That it wasn’t really something someone could just pick up and know exactly what they were going to do,” Petersen said. “So, that was obviously one of the main reasons the guidelines got updated, but also to integrate all the changes we made in the Sandy atlases, which were somewhat significant.”


These guidelines are particularly important for understanding the data layers involved in an ESI map. The team from NCCOS helped with this effort by writing a chapter in the guidelines specific to metadata.
“If you open up an ESI geodatabase, a well-written metadata record is a great guide to learning why something was created, how it was created, and what the different pieces mean and how to interpret it,” Nelson said.
“Before the chapter on metadata, there was a data dictionary in the guidelines document. But it wasn’t nearly sufficient enough to tell a contractor how to collect and manage metadata,” Dorfman said. “Each layer within an ESI geodatabase would have a metadata record that might be 10 or even 20 pages long. So by the time you add up layers for human use, biology, shoreline, it amounts to quite a lot.”
The team also developed templates for new metadata entries and provided instructions for how to make them. Updated guidelines were published earlier this year, and are now available for download.
From the boots-on-the-ground efforts following Hurricane Sandy, to keeping ESIs and their guidance documents up to date, NCCOS continues to be an important partner in sensitivity mapping. For more information about how NCCOS supports NOAA’s mission, visit coastalscience.noaa.gov.