
On April 20, 2020, NOAA will join our state and federal partners in observing 10 years after the Deepwater Horizon oil spill — an incident that resulted in the tragic loss of human life and an unprecedented impact to the Gulf’s coastal resources and the people who depend on them. From March 30 to April 20, tune in as we go back in time to the day of our country’s largest marine oil spill, what’s happened since then, and how we’re better prepared for future spills.
Ten years ago an experimental satellite-based Marine Pollution Surveillance Report program was thrust into the national spotlight during the Deepwater Horizon oil spill. Since then, this program has grown in scale and accuracy, becoming an indispensable tool for oil spills of all sizes. This guest blog by Juan Velasco and Ellen Ramirez explores the story behind NOAA’s Marine Pollution Surveillance Program.


An Experimental Technology to Detect Oil in the Ocean
It’s early 2010, and we at NOAA’s Satellite Analysis Branch (SAB)—in the Office of Satellite and Product Operations—had no idea that one of our fledgling projects was about to undergo trial by fire during the largest marine oil spill in U.S history.
SAB uses satellite data to generate value added products to support the federal government to warn the public of, respond to, and assess the damage from natural and man-made disasters.
Prior to Deepwater Horizon our regular work included tropical cyclone position and intensity derivations, volcanic ash detection and forecasting, wildfire and smoke mapping, and heavy precipitation guidance. Our oil spill monitoring was still at an experimental stage.
The Marine Pollution Surveillance Program began in the mid 2000s at the request of NOAA’s Office of Response and Restoration. They saw SAB’s work as an untapped resource for oil spill emergency response. This gave us time to create the sophisticated operational procedure to map the extent of marine oil using space-based radar and visible satellite imagery. It was an experimental project, producing maps for a small internal audience.
We never could have predicted what happened next.
A Trial by Fire
The April 2010 Deepwater Horizon oil spill emergency launched SAB’s experimental oil spill maps into the public spotlight. Specifically our daily composite product, in which all available satellite imagery on a given day is overlaid to produce a collective outline of the extent of oil, became the topic of national news stories and congressional briefings.
Oil spewed from the underwater well for three months, and our primary concern throughout this time was to determine which areas were affected and how far the oil had spread. Our satellite analysis proved well suited to help answer these questions.
After the well was capped, NOAA made a concerted effort to promote the expansion of utilizing remote sensing data during and after oil spills. SAB also implemented routine monitoring of U.S. waters to detect accidental and intentional oil discharges. Peering down from satellites allows us to proactively discover and report oil spills efficiently, accurately, and over huge areas of ocean.
In the Decade Since Deepwater Horizon
In the 10 years since Deepwater Horizon, SAB’s advances with oil spills are evident in our monitoring abilities, slick detection and characterization techniques, and in the audiences that utilize our work. The U.S. Coast Guard, Department of the Interior, Environmental Protection Agency, Department of Defense, Bureau of Safety and Environmental Enforcement and many other state and local governments all utilize our Marine Pollution Surveillance Program.
Our monitoring abilities have improved with both the increased amount of openly available imagery, and with our improved ability to distinguish oil slicks from false positives like algal blooms or seaweed on the ocean's surface.
This results in more accurate reporting. We also have a more comprehensive understanding of how conditions in the air, in the water, and on the ocean floor influence how oil in the ocean appears.
However, to understand some of our more complex advancements you first need to understand the two main types of satellite data that NOAA uses for oil spill monitoring.
Automated Oil Detection Using Synthetic Aperture Radar (SAR)
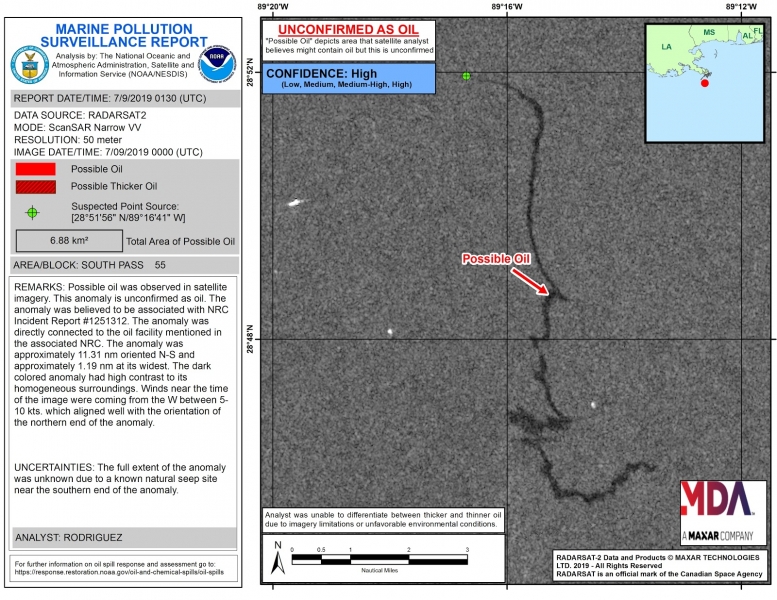
SAR imagery tells you something about the roughness of the Earth’s surface, whether over land or water. In the marine environment, oil film dampens very tiny wind-driven waves, reducing the amount of energy that’s reflected back to the satellite. The result is that the oil slick appears “smooth and dark” in comparison to its surroundings, making the oil very easy to identify
One advantage of SAR imagery is that it allows for the detection of oil overnight and through clouds. However, sometimes the analyst has trouble telling oil apart from false positives like vegetation, upwelling, sea ice or areas of low wind.
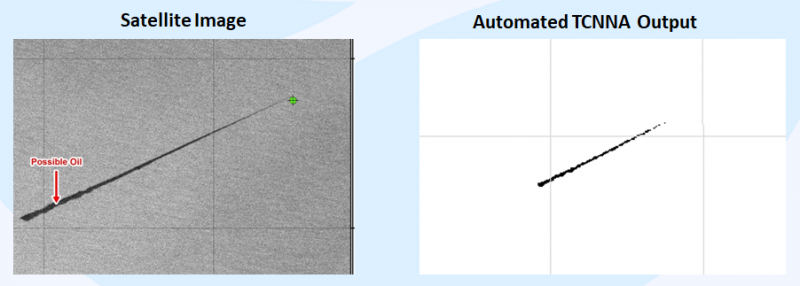
In order to scan a large amount of imagery for oil in a relatively short amount of time, we recognized that we must investigate options for automated oil detection. To aid in this endeavor, SAB leveraged the work of a government contractor colleague to implement their Texture Classifier Neural Network Algorithm into our operations. This algorithm provides us with a first look of whether or not the scene might contain an oil spill.
If it gives us a “yes,” then we take a closer look using additional tools and information.
The presence or absence of oil is a critical piece of information during a spill emergency. However, in addition to understanding where oil slicks are, it’s important to understand what kind of oil we’re dealing with.
Oil Slick Thickness Assessments in Visible Imagery
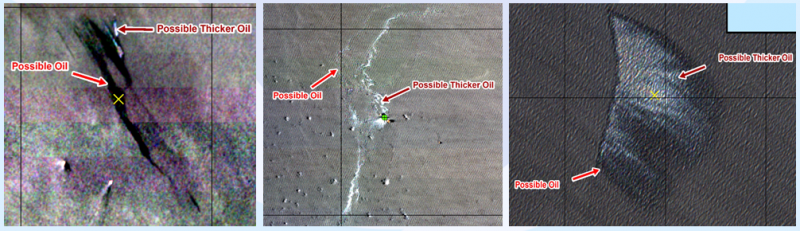
SAB analysts, in collaboration with federal and contracted colleagues, have developed technologies to distinguish relative thickness within the oil footprint using visible imagery.
Characterizing oil slicks helps responders make decisions on the most effective methods to contain, clean up, and protect the environment from oil spills. For example, thick oil can sometimes be skimmed or burned from the surface, while rainbow-colored sheens are too thin to be removed. Oil spill thickness information can also be used to determine which areas are being more heavily impacted by the oil.
The advantage of visible imagery is the ability to generate wavelength combinations that help distinguish oil from vegetation and other false positives. The disadvantage of this method is that it’s only possible during daylight hours and cloud-free weather.
During the summer when there's moderate to strong sunlight, we often observe variable colors within the same oil slick. This color information allows us to tell thicker areas from thinner ones, and then deliver information about both oil types. Even when there isn’t enough illumination for this, we still gather valuable information to help scientists understand the oil spill.
NOAA’s Eyes in the Sky Surveilling for Pollution
One of the biggest advantages of SAB’s oil spill maps and products is that they can be published in near real-time, and are available for the public online. By logging on you can view the most recent oil slicks detected in U.S. waters as a downloadable report, or as an interactive web map through NOAA’s Environmental Response Management Application.
This allows NOAA to share this important information with stakeholders in federal, state, and local governments that rely on this information for the safety of communities, economies, and ecosystems. These reports are also used by other researchers and members of the public, which promotes the advancement of science through data sharing.
We at SAB are proud to generate products that map and describe the characteristics of oil spills, providing experts the sound science they need when oil spills in U.S. waters.
This rapid detection enables quicker and more effective cleanup, limiting impacts and promoting rapid recovery of natural resources that coastal communities rely on.