
This month, NOAA’s Office of Response and Restoration released a new version of the Environmental Response Management Application (ERMA®). ERMA is a web-based mapping application used by environmental responders and natural resource decision-makers. It serves as the Common Operational Picture (COP) for NOAA and the U.S. Coast Guard, as well as other state and federal agencies, during environmental disaster response and cleanup. Below, we’ve highlighted key enhancements in the recent release, including a host of new features, tools, and optimizations, as well as improved mobile device responsiveness.
Enhanced Map Filtering
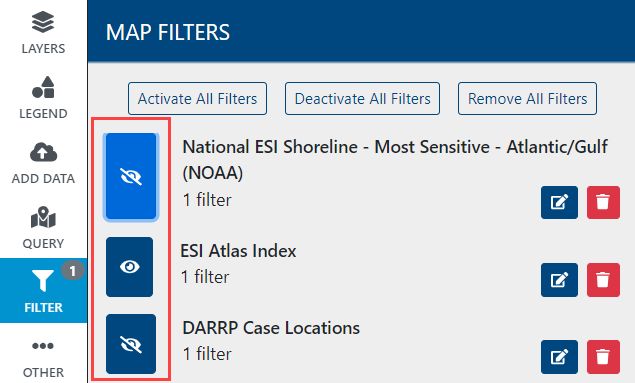
One of the standout features of ERMA’s latest release is a new filter tool that allows users to filter down to the data displayed on the map. If you're tracking spill locations, monitoring wildlife habitats, or assessing contamination levels, the ERMA filter tool allows you to tailor your map view to the specific data that you need. This provides a cleaner picture for easy decision-making. Below is an example of map data applied in three different filters. In this example, the Environmental Sensitivity Index (ESI) shoreline map is displaying only marsh shoreline, the ESI Atlas Index area of interest is showing only the New York/Long Island area, and the Damage Assessment, Remediation, and Restoration Program (DARRP) case locations are showing only oil spill cases and not hazardous waste sites or ship groundings.


To filter map data, simply turn on layers in the table of contents and click the filter menu tool. Then, choose the edit filter option for each layer and select an attribute and value to filter the data on. One or more filters can be applied to each layer.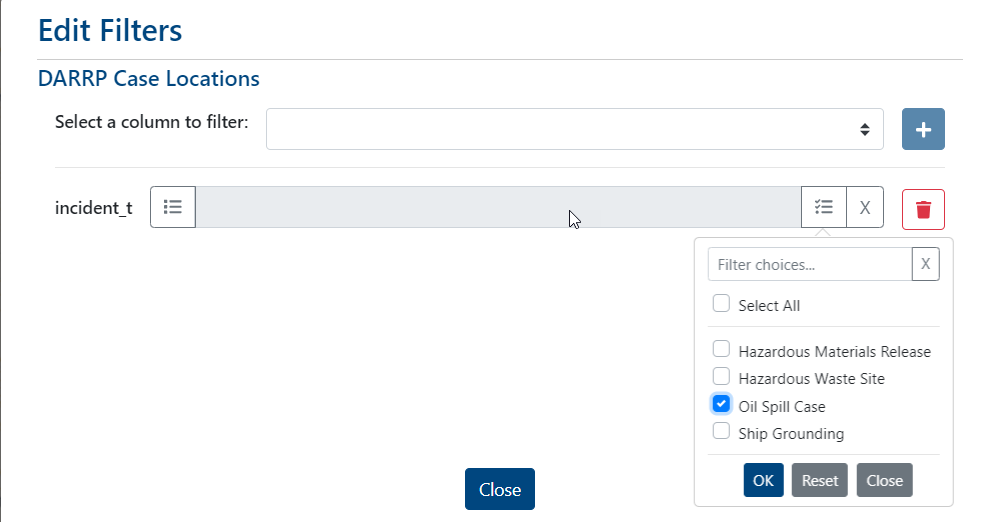

Users can toggle filters on and off from the main filter window. When a filter is applied, a numeric value will be shown on the tool menu, indicating how many filters are applied.
Dashboard Data Filtering
The latest ERMA release also introduces powerful data filtering options within dashboards. Users can dive deeper into datasets by applying filters directly within the dashboards to extract and visualize insights quickly. ERMA dashboards can now be customized to allow users to filter data from charts or stat cards.
Dashboard cards will show a filter icon in the bottom right corner when filtering is supported. When clicked, the map will filter the data showing only the subset of data from that card or chart.

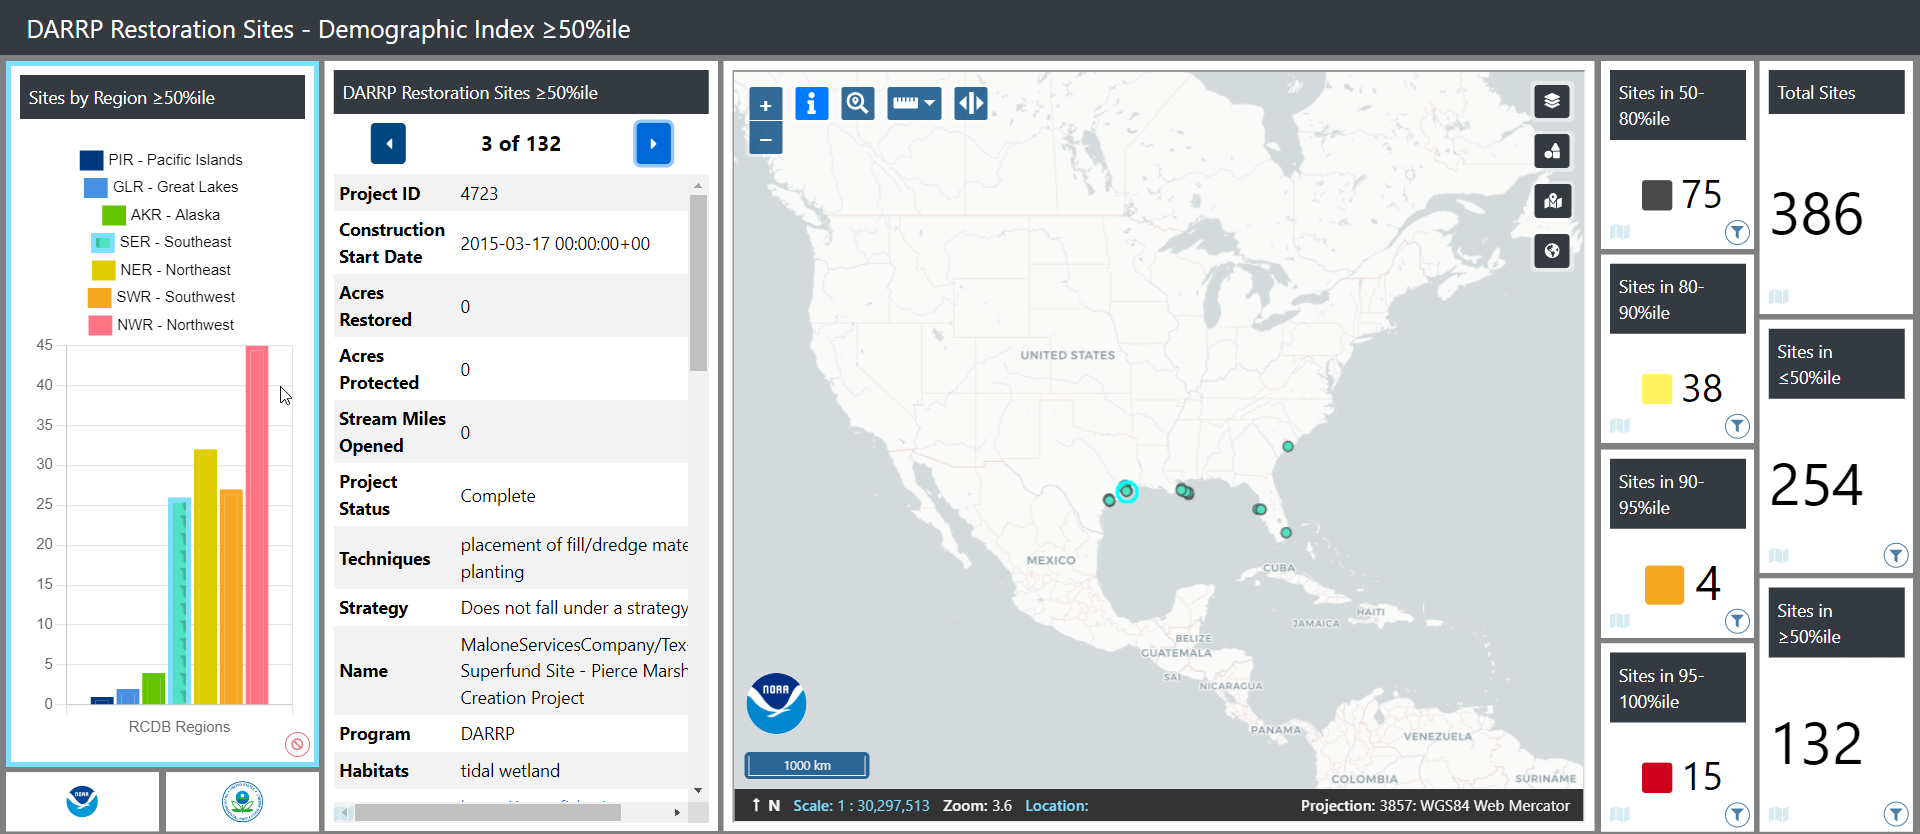
The dashboard above shows blue markers on a map which indicate restoration sites with environmental and demographic socioeconomic indicators from the Environmental Protection Agency (EPA)’s EJSCREEN. Cards that filter map data have the filter icon shown in red boxes. Seen in the example below, selecting a bar from the ‘Sites by Region’ chart will filter the blue markers on the map to show only points for that specific DARRP region. When a filter is applied, the card for the filter is highlighted in light blue.
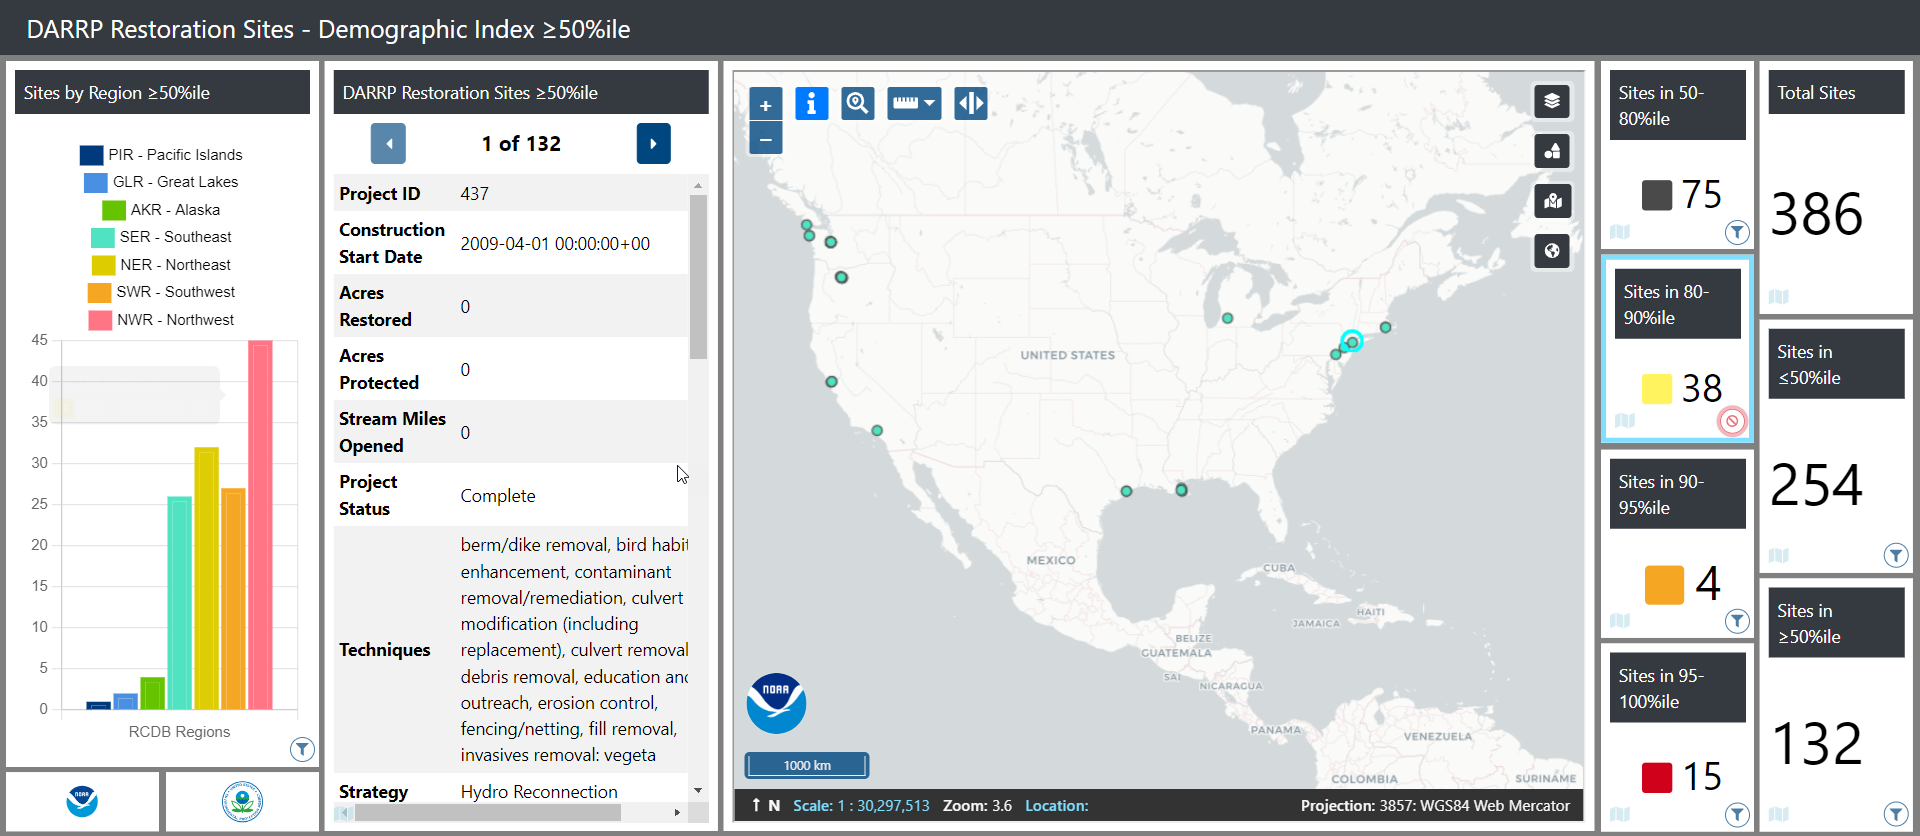
Stat cards can also be used to filter map data. In the example below, restoration sites that are not within the 80-90 percentile are filtered out, showing only a few sites that fall within the range.
Revamped Table of Contents for Intuitive Navigation
 We understand the importance of a user-friendly interface and have revamped the Table of Contents to provide a more intuitive navigation experience. The improved look and feel makes it easier for users to locate and access relevant information swiftly. Some of the changes within the table of contents are:
- Improved spacing and padding between folders and layers, including visual lines to help indicate the folder depth of a layer that may be nested in several subfolders.
- Consolidation of information for layers.
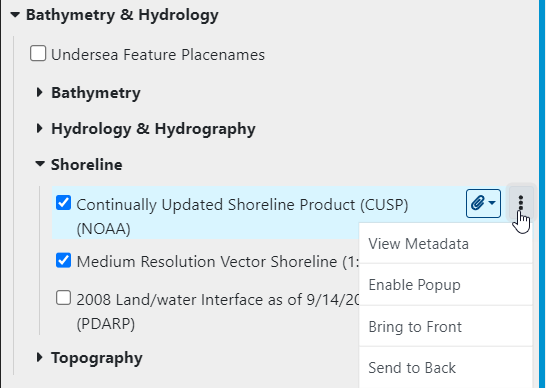
- Each layer will have vertical eclipses where users can find layer options to zoom to an extent, find metadata, or other useful tools for displaying information.
- Instead of listing out all of the attachments, they are consolidated into a single paperclip icon that can show all of the available links or files for a layer.
- For layers with a time component, the time slider clock still shows beside the layer for users to enable the time slider tool.
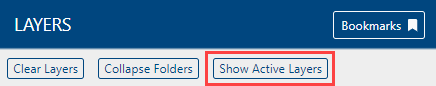
- A new table of contents button was added to allow users to only expand folders with active layers.
Streamlined Bookmark Access
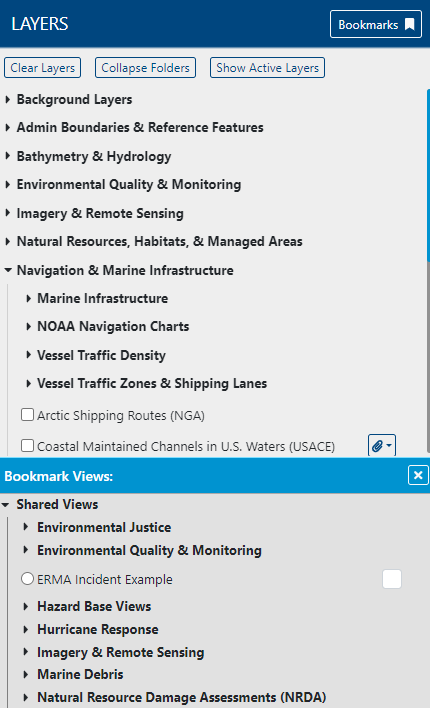 Bookmarks, which contain sets of saved layers related to specific subjects, are now easily accessible using the bookmark ribbon at the top of the table of contents. Users can save frequently used views, filters, and settings with a single click, ensuring seamless workflow continuity, especially in time-sensitive environmental response scenarios.
Next Steps & More
While we've highlighted some of the major updates in this release, we encourage you to explore the application further to experience all that's new. Stay tuned for future ERMA releases, as we're committed to providing seamless display, visualization, and data investigation tools for environmental disaster management.