
This week, we’re taking a closer look at what sensitivity mapping is, how it’s used, and why it’s so important. A snapshot of the resources in a specific area, sensitivity mapping can be a valuable tool both in and out of the spill response community.

Environmental Sensitivity Index (ESI) maps and data provide concise summaries of coastal resources that could be at risk in the event of an oil spill. When a spill occurs, ESI maps can help responders meet one of the main response objectives: reducing the environmental consequences of the spill and the cleanup efforts. Additionally, ESI maps can be used by response planners — before a spill happens — to identify vulnerable locations, establish protection priorities, and identify cleanup strategies.

ESI maps have been an integral component of oil spill contingency planning and response since 1979, when the first ESI maps were prepared days in advance of the arrival of the oil slicks from the IXTOC 1 well blowout in the Gulf of Mexico. Since that time, ESI data have been compiled for most of the U.S. coast, including Alaska, the Great Lakes, and the U.S. territories. Today, they are downloadable for free in a variety of formats. Where available, you can also view ESI data or PDF maps in ERMA®, an online mapping tool for environmental response data, adapted to a variety of regions.
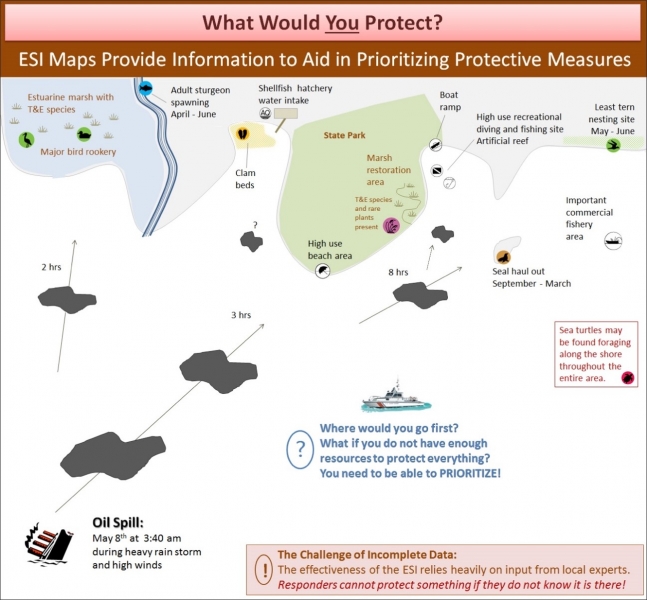
The main elements depicted on ESI maps are shoreline types, biological resources, and human-use resources. On the maps, shorelines are ranked and color-coded according to their sensitivity to oil, the natural persistence of oil, and the expected ease of cleanup after an oil spill. The location of oil-sensitive animals and their habitats, and habitats that are themselves sensitive to spilled oil (such as coral reefs), are shown with symbols and colors. Also represented on the maps are the location of human-use resources that are vulnerable to oil spills (such as public beaches or parks), or areas that could be used as access points for oil spill cleanup.
The earliest ESI product was a collection, or atlas, of color paper maps, covering a coastal state or region. Because of reproduction costs, these had a limited distribution and were also challenging to update. Since 1989, the ESI data have been compiled using a geographic information system (GIS). The digital ESI data serve a broad audience, as they lend themselves well to targeted queries, integration with other regional data sets, and customized products. Despite this, there is still demand for the printed and PDF ESI maps, and NOAA continues to support that user community.
The spill contingency planning requirements of the Oil Pollution Act of 1990, and similar legislation passed by many states, require information on the location of sensitive resources to be used as the basis for establishing protection priorities. Standardizing the basic ESI elements speeds the development of systems and facilitates their use by national response teams and organizations, such as the U.S. Coast Guard, industry response staff, and spill cooperatives. Data sharing and updates are greatly facilitated by a uniform data structure. To facilitate a standardized approach, NOAA's Office of Response and Restoration has created in-depth guidance for developers of ESI data, which assists contractors to NOAA, as well as those working independently for a state, region, country, or industry.
We would be remiss without acknowledging the significant contributions of resource experts in agencies both in and out of NOAA. ESI maps and data are created by working with colleagues in state government agencies, federal government agencies, and industry to identify and represent the comprehensive biological and human-use portions of these maps. The ESI maps and data would not be possible without the support of these regional resource experts.
It's important to remember that ESI maps are important decision-support tools and a critical source of information to help responders with their decisions during an incident. The final choice will be the responsibility of the responders, who will take all relevant factors into consideration to provide the most effective spill response.
Stay tuned for more this week as we continue to delve into the importance of sensitivity mapping.