
Just before midnight on April 22, 2018, the M/V Iver Exporter was removing the sea water taken on the ship — also known as ballast, this water is used for balancing cargo — when the crew spotted a black sheen of heavy fuel oil around the vessel on the Mississippi River near New Orleans. Responders moved into action to stop the spill and protect our natural and man-made resources. But how did they ensure everyone was on the same page, looking at the same map?
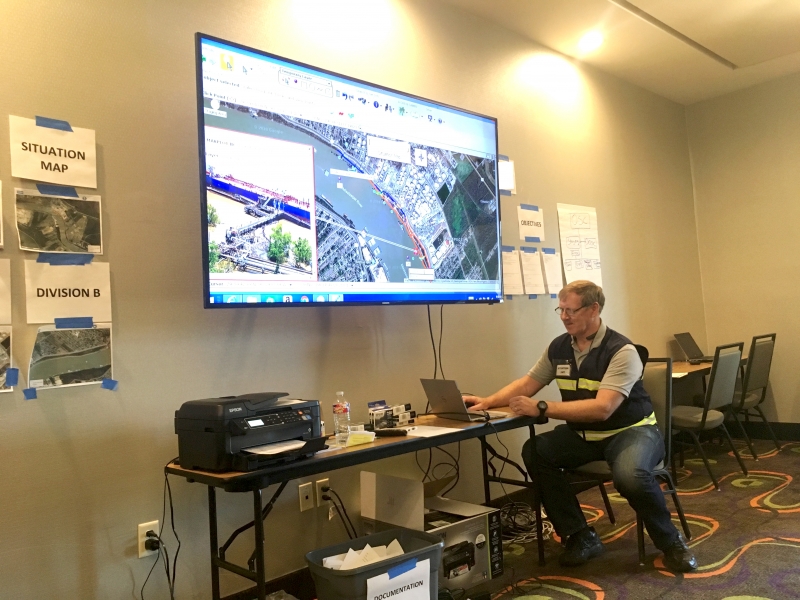
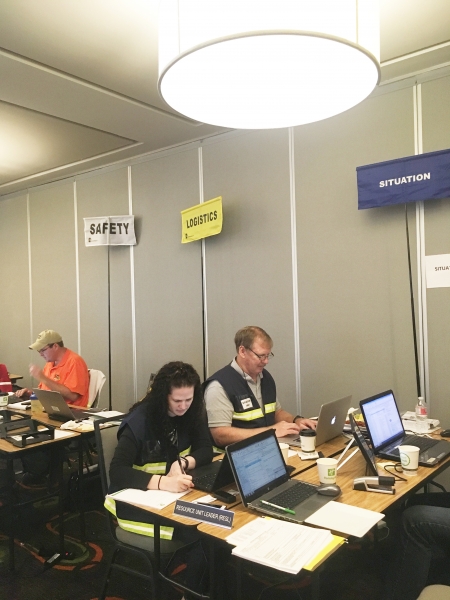
In the Incident Command Post, Situation Unit Leader Bob Bradley from Penta Consortium LLC decided to use MARPLOT®, OR&R’s mapping software, to coordinate the response and cleanup. With all the moving pieces involved in response — including on-shore and on-water cleanup — having a single map with all the moving parts was crucial.
The first step for local response teams was plotting where the oil had traveled so that they could identify what areas needed to be cleaned. Using aerial photos of the area from a helicopter, the team created objects on the map that represented areas that needed to be decontaminated. They also imported photos from boats so that when the team clicked on a specific location, they could see the spill from that particular vantage point.
While teams on the shoreline assessed the contamination along the river’s edge, Bradley and his team plotted the data in MARPLOT using color-coded objects to indicate light, moderate, and heavy oiling. They also used the mapping software to determine what resources were needed to contain the floating oil. The team decided to use boom to slow the spread of the oil, but how much boom was needed? Bradley drew a line on the map representing where the boom was to be placed. He could instantly see how many feet the line was, which told responders how many feet of boom they’d need to prepare to contain the spilled oil.
Throughout the process, Bradley displayed the MARPLOT map on a 60-inch monitor in the Incident Command Post so that the entire team could see the spill and response area. They were also able to use the software imagery for updates and briefings, or import objects into Google Earth to share with additional parties.
“Lots of people saw MARPLOT in action for the first time and became aware of what it could do,” Bradley said. “Everyone was really pleased with the capability MARPLOT provided.”
He also noted the importance of the software’s unique ability to work offline. Although the Incident Command Post had internet access during this response, connectivity can fail quickly and without warning in larger-scale disasters. With OR&R’s mapping tool, teams can still work together using the same common operating picture, even without internet.
This tool is part of the CAMEO® software suite, a set of programs offered at no cost by NOAA’s Office of Response and Restoration and the EPA’s Office of Emergency Management. Trainings are available for MARPLOT and other CAMEO products throughout the year.
Bradley and his team at Penta Consortium LLC will be sharing more about how MARPLOT can be used for incident response at the International Hazardous Materials Response Teams Conference in Baltimore, Maryland on June 7, 2018.